
6. Full Spectrum Analysis
Gamman applies an implementation of the Patented Medusa Full Spectrum Analysis method. Using FSA, virtually all information present in a gamma spectrum is utilized to derive radionuclide concentrations.
In 'classic' software, the reduction of the spectral information measured into concentrations of radionuclides, is mostly done using the Windows analysis method [see e.g. Grasty et al., 1985], or one of its derivatives. In Windows, the activities of the nuclides are found by summing the intensity of the spectrum found in a certain interval surrounding a peak. In “classic” Windows, three peaks are used to establish the content of 232Th, 238U and 40K.
A major drawback of the Windows method is the limited amount of spectral information that is incorporated into the analysis. Another weakness is the inherent use of stripping factors to account for contributions of radiation from nuclide A into the peak of nuclide B. Application of these stripping factors lead to propagation of uncertainties most prominently felt in the determination of the 238U concentration.
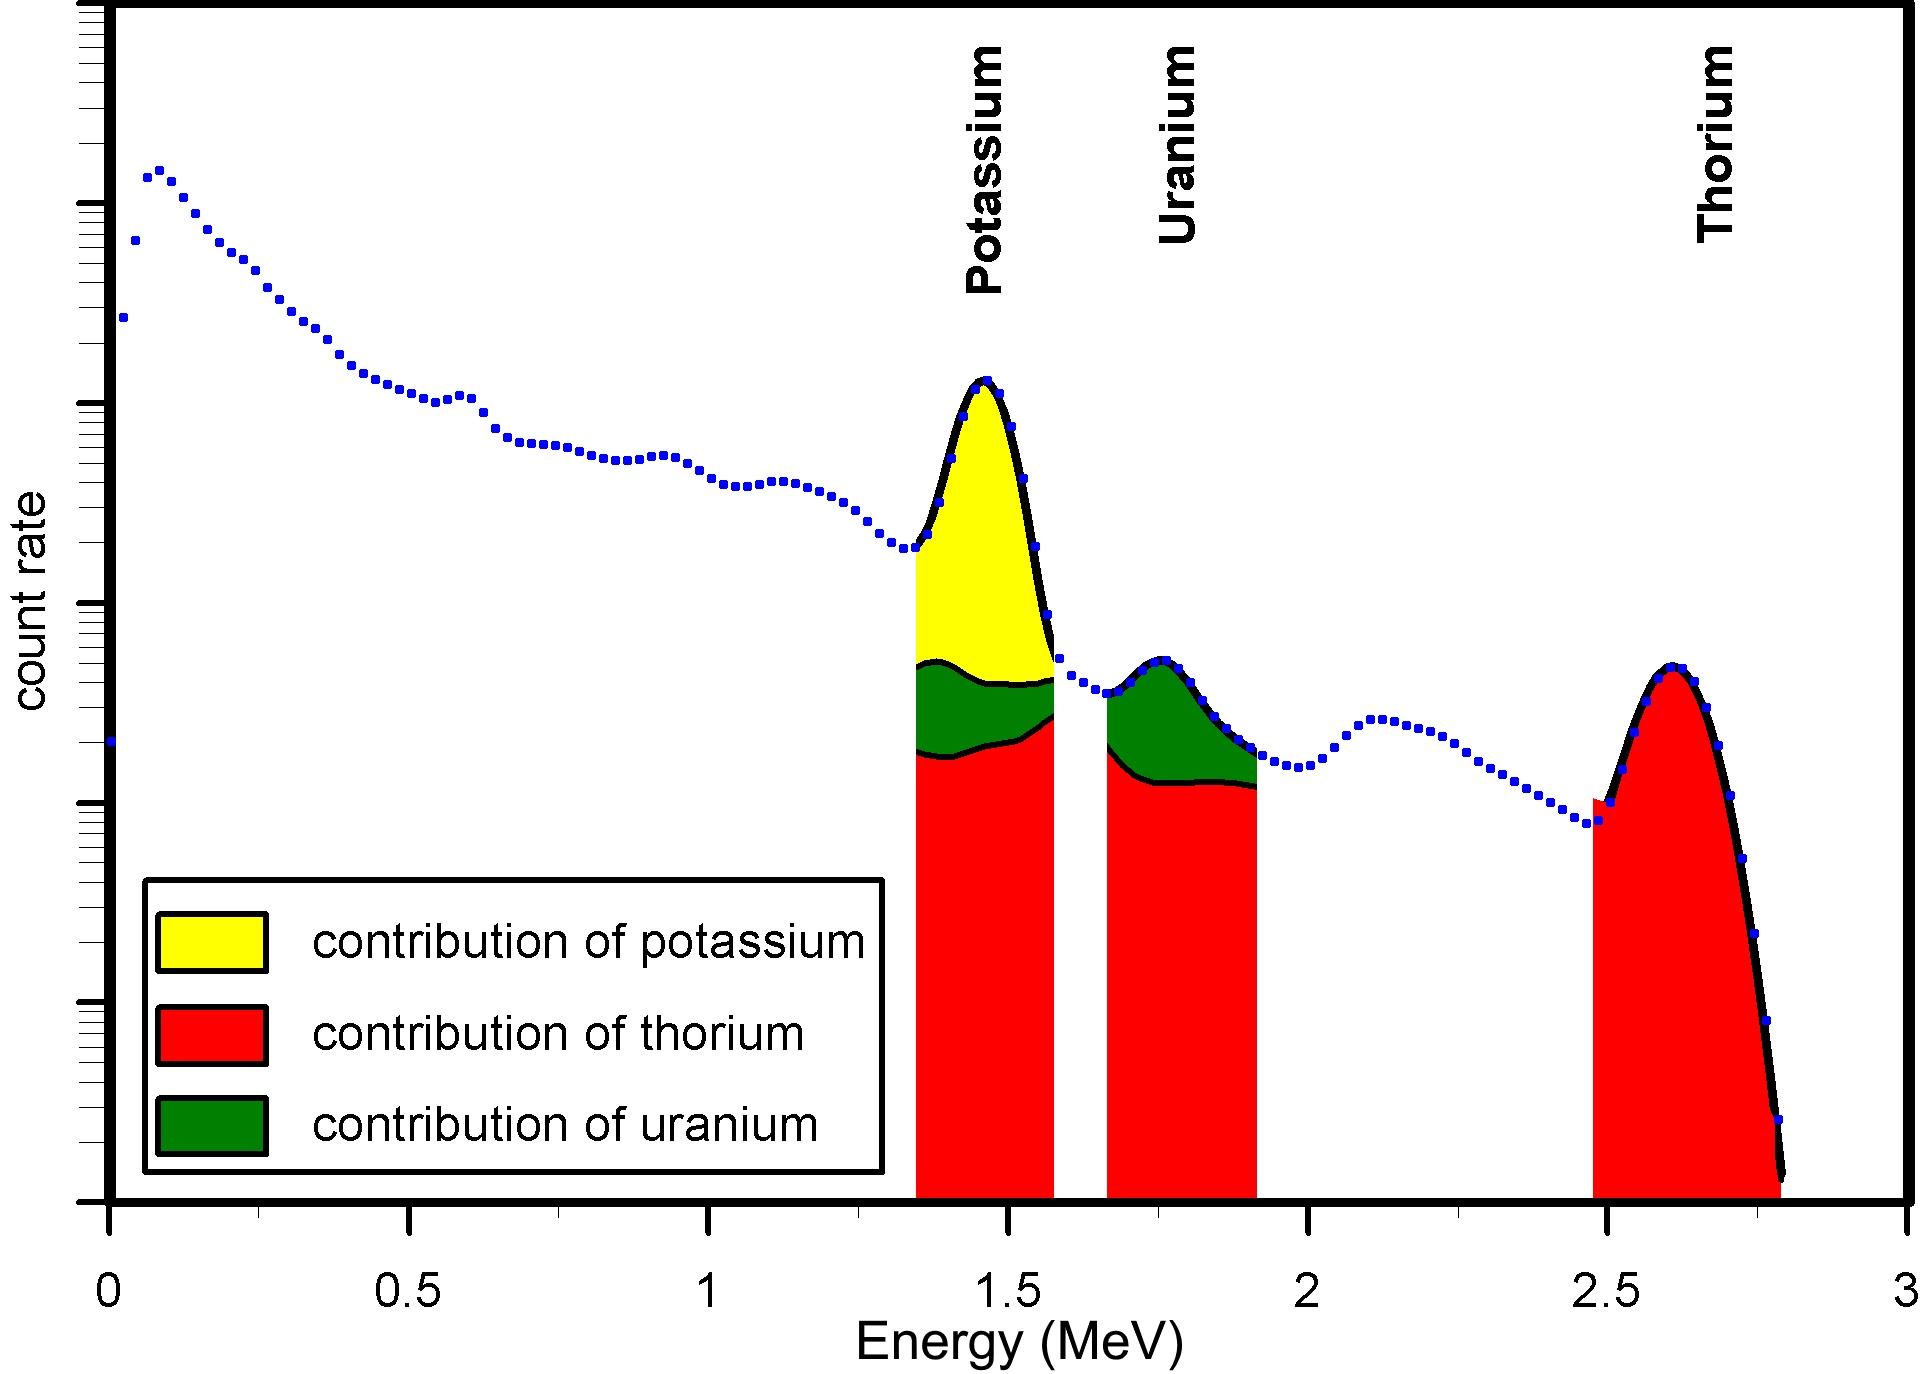
Figure 1: Windows analysis of a natural gamma spectrum (blue dots). Only a part of the measured spectrum is approximated by a fitted curve (black line), a large part of the measured spectrum is not used. In each peak the contribution of surrounding peaks is subtracted ('stripping factors'). Note the logarithmic Y-axis.
In contrast to the 'Windows' method described before, Full Spectrum Analysis (FSA) incorporates virtually all of the data present in the measured gamma spectrum. In FSA, a Chi-squared algorithm is used to fit a set of “Standard Spectra” to the measured spectrum (see Figure 2). The fitting procedure yields the multiplication factors needed to reconstruct the measured spectrum from the standard spectra. The multipliers equal the actual concentrations of the radionuclides that led to the measured spectrum. The method is described in detail in Hendriks [2001].
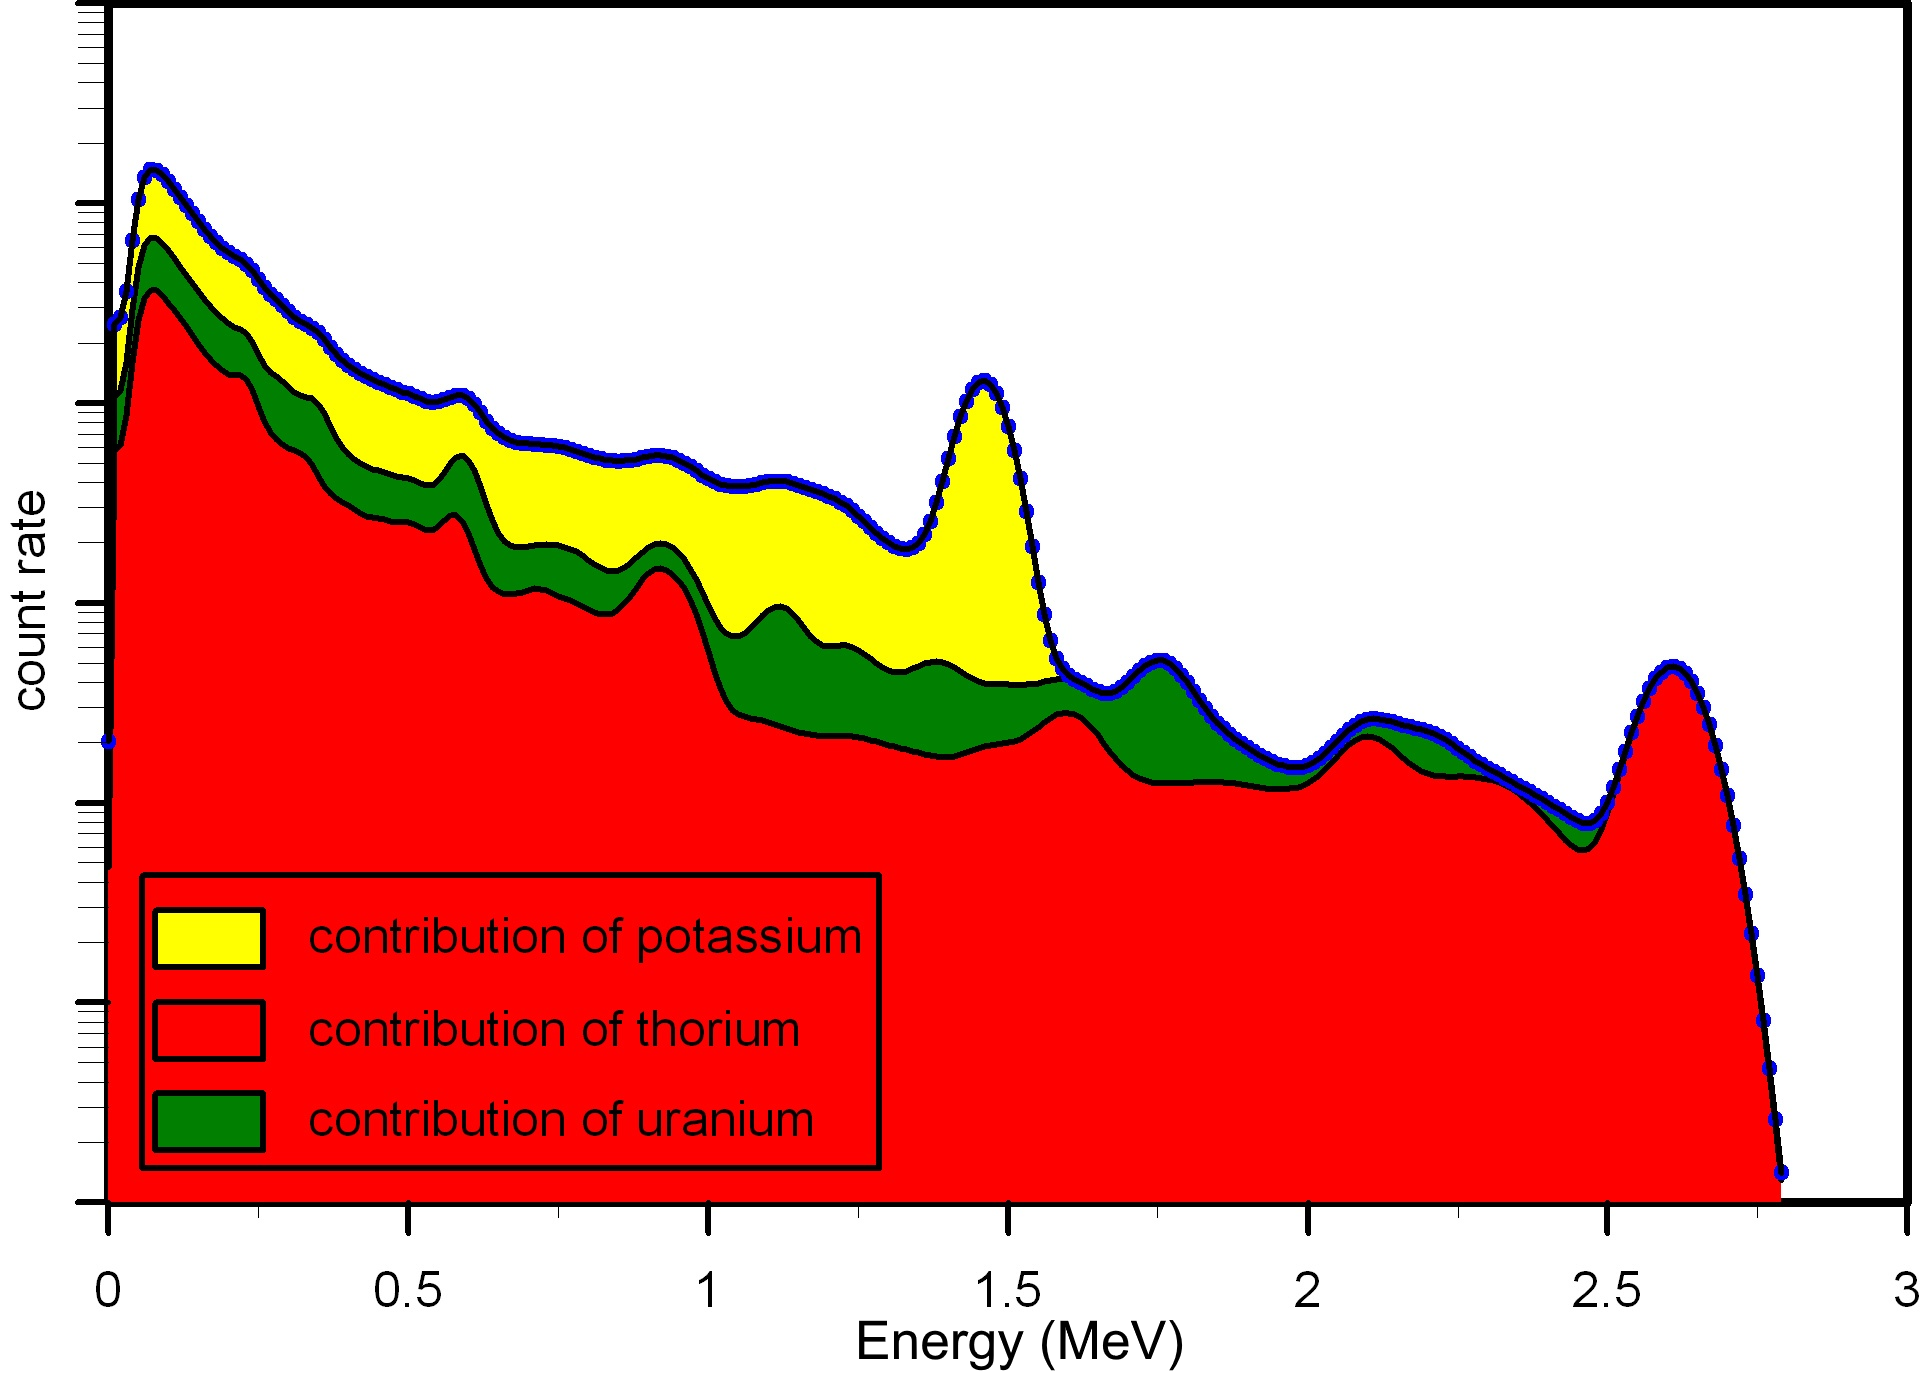
Figure 2: FSA analysis of a natural gamma spectrum. The measured spectrum (blue dots) is approximated by a fitted curve (black line). This curve is composed of the complete spectral contribution of 40K (yellow), 232Th (red) and 238U (green).
Figure 3 shows an example of the advantage of using FSA versus Windows. The figure shows the uncertainty in the 232Th concentration, calculated using “Windows” and FSA, as a function of spectral content (counts). The difference in uncertainty is about a factor of 2 regardless of the spectrum content. This implies a difference of a factor 4 in count rate needed to achieve the same accuracy!
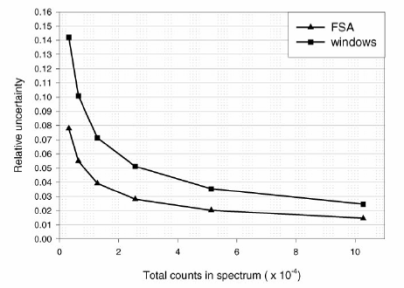
Figure 3: the relative uncertainty in the activity concentrations of 232Th spectra analysed according to the full-spectrum analysis (triangles) and traditional windows analysis (squares) as a function of counts in the spectrum [taken from Hendriks, 2001].
However, before a multichannel spectrum can be treated using FSA, it must be energy stabilized That is, the channel (X) axis must be translated into an energy axis. The next topic describes the procedure.
Literature
Grasty, R.L., Glynn, J.E. and Grant, J.A. 1985. The analysis of multichannel airborne gamma-ray spectra. Geophysics . 50.
Hendriks, P.H.G.M., Limburg, J. and de Meijer, R.J. 2001. Full-spectrum analysis of natural gamma-ray spectra. Journal of Environmental Radioactivity, 53: 365-380.