
Test UAV survey
Survey summary
| Descriptive name | UAV grid and heights |
| Date (range) |
|
| Done by | Steven van der Veeke |
| Application type | Demo environmental mapping |
| Geometry of survey | UAV (Drone-borne survey) |
| System applied | MS-350 CsI |
| Carrier | Drone |
| Raw data grid | 20210610T112309Onstwedde20210610.mdl 20210610T121219Onstwedde20210610.mdl 20210610T130120Onstwedde20210610.mdl |
| Gamman data grid | |
| Output grid | |
| Raw data heights | 20210610T132043HoogtesOnstwedde.mdl |
| Gamman data heights | 20210610T132043HoogtesOnstwedde.gsf |
| Output heights |
Survey description
This survey was done as a test with a UAV (Unmanned Aerial Vehicle) carrier. Here, an MS-350 detector was carried by a drone and flown over a field near Onstwedde, Groningen. At first, a measurement grid is flown over the field and secondly, there has been flown at different heights at a fixed position. This survey is a very good example of measuring following a grid and also flying at different heights.
Data processing
Grid measurement
In this dataset, an equally spaced grid is flown over a field. To analyse the correct data, unwanted data (like data measured at the beginning and end points) have to be omitted. This can easily be done using Gamman. After opening the Gamman data, we can switch to "data view" to plot the data using various parameters. In this example, the easiest way to select the correct data is to plot the GPS longitude on the x-axis and GPS latitude on the y-axis. The grid that is flown during the survey can now clearly be seen (figure 1.) The data that may be unwanted are the data points at the far right of the grid: the start and end of the survey. To omit these points, a polygon can be drawn around those points by clicking on the plot while holding the Alt-button on the keyboard. The points selected within the polygon can be taggen by clicking the "Tag records" button (all tagged records within a polygon can also be deselected by clicking "Clear records.")
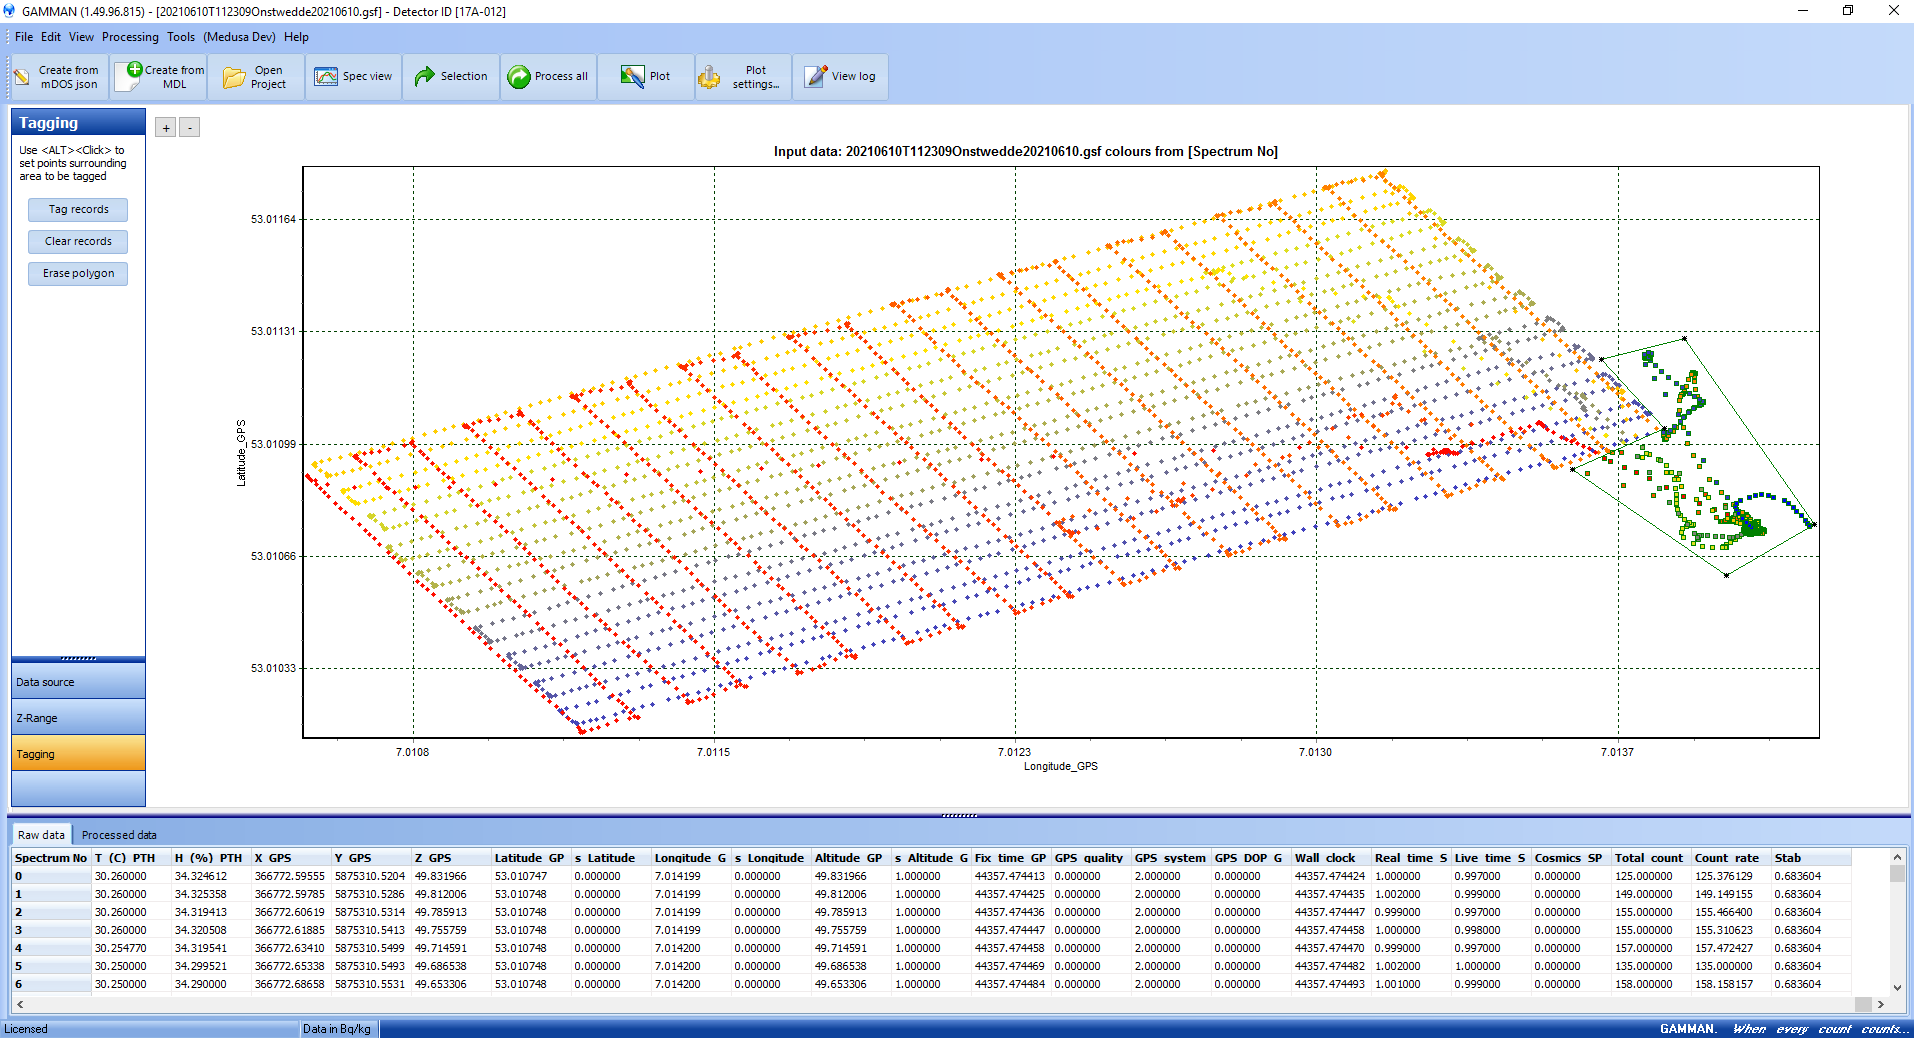
Figure 1: Tagging unwanted data using the plot function
After selecting the raw data that you want to analyse, this data needs to be processed. This will calculate nuclide concentrations based on a certain fitting scheme. Clicking "Process all" will let you process all untagged data. The window shown in figure 2 will appear. Five different fitting schemes can be chosen (these are explained in the Gamman manual.) Here, "Fit each" is chosen and after processing, the results will appear under the tab "Processed data." Plotting this processed data will show that the tagged records are not included (see figure 3.)
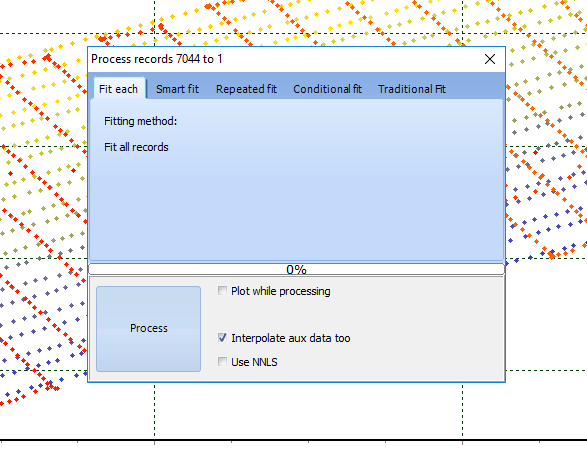
Figure 2: The "Process records" window
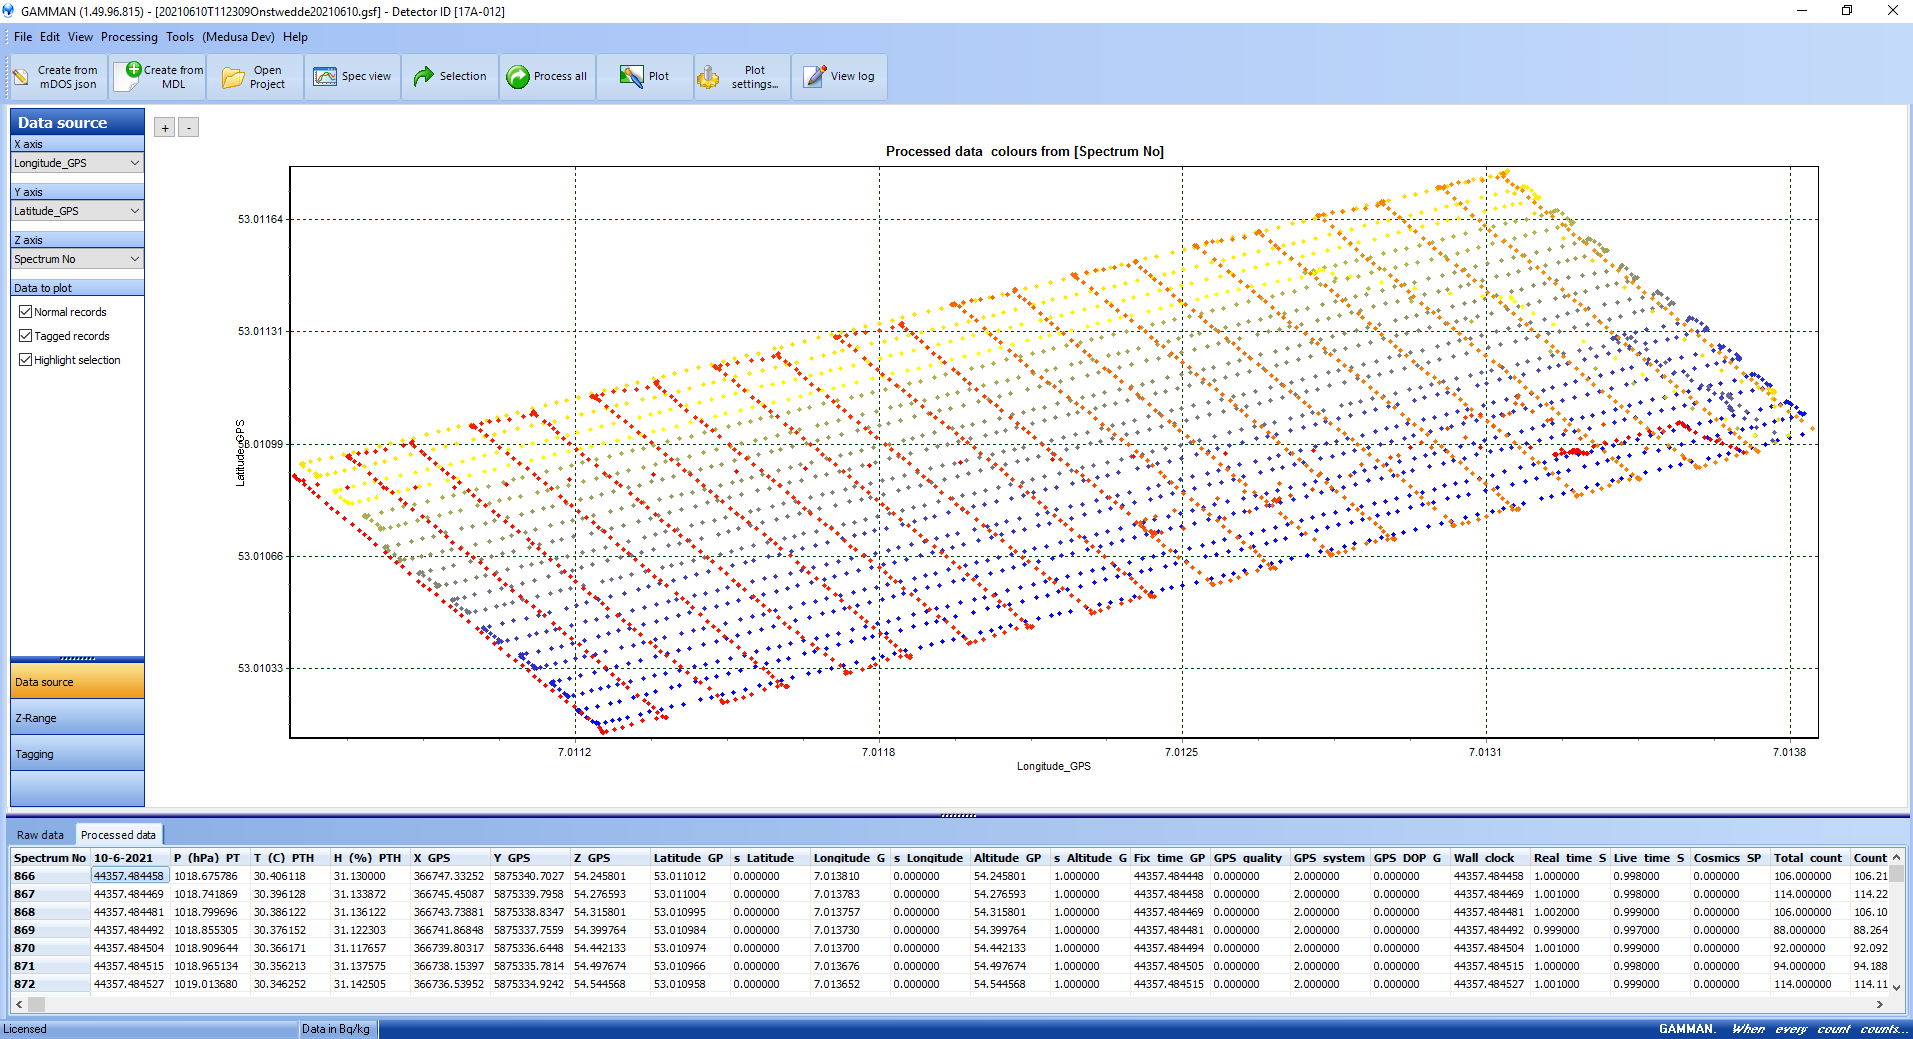
Figure 3: Plot of the processed data (thus excluding tagged records)
A csv file including the processed data can be made by clicking the tab "file" and then "export results..." and can be used in other analysing programs. The menu seen in figure 4 will appear and here you can select the type of spectra you need. The csv file can include the energy stabilized spectra (distributed over a chosen amount of channels,) raw spectra and the processed spectra.
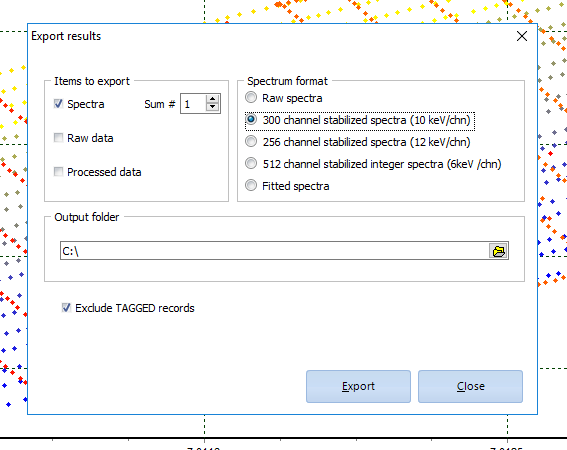
Figure 4: The "Export results" window
Height measurements
In the second part of this survey, the drone has flown at different heights above a fixed point on the ground. Plotting the GPS altitude against the time, we see that the drone has flown for one to two minutes at certain heights (figure 5.) These heights can be investigated individually by drawing a polygon around the data points received at a certain height and tagging the rest of the data points. In figure 5, this is done for an altitude of approximately 77m. This data can also be processed by clicking "process all" and exported. In this way, data for different heights can be processed separately and be more easily compared to each other. Another way to do this is to click on one data point, hold "shift" on the keyboard and click another data point. All data points which are chronologically between these two points will be selected and these can be processed by clicking the "selection" button. In the survey summary table, some of these height-files are included.
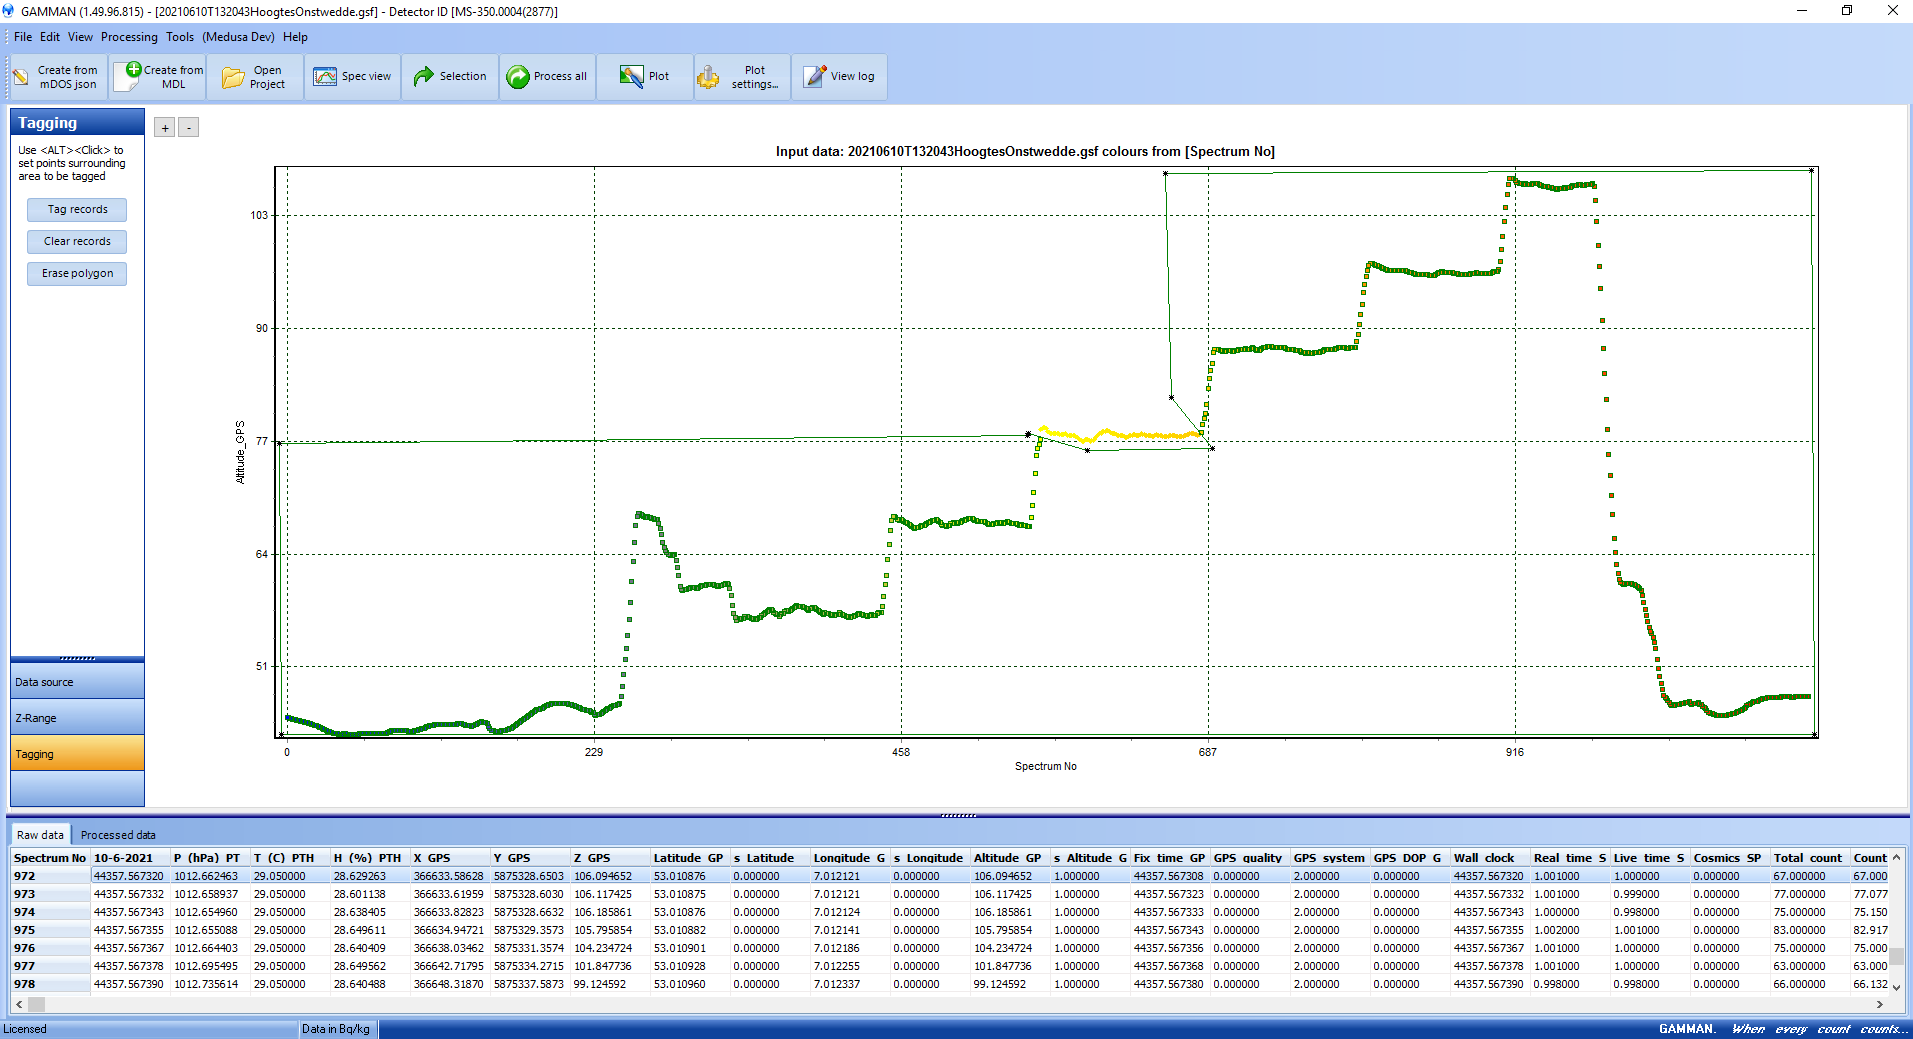
Figure 5: Selecting data points at a certain altitude