Dashboard
The dashboard is the default landing page when accessing the spectrometer. The page gives a basic insight into the measurements of the connected sensors, settings and detector information.
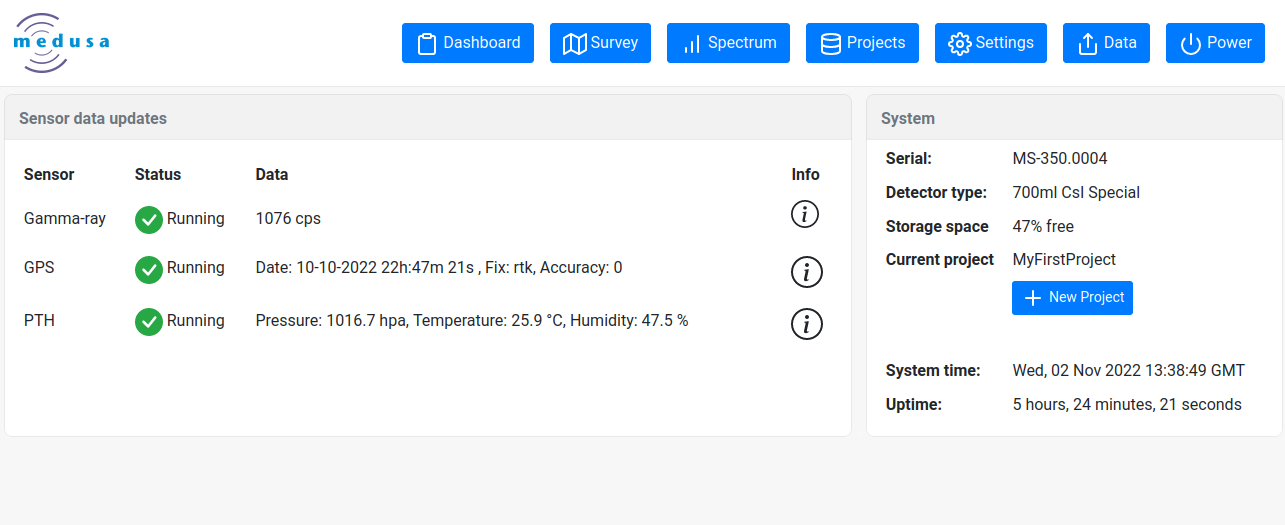
Sensor boxes
The table below describes the information boxes displayed on the Dashboard page. The sensor boxes contain an information icon (
| Box | Figure | Description |
|---|---|---|
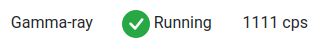
| Spectral updates |
| A number displaying the live count rate measured by the scintillation crystal. |
Position |
| Positional information. This can be recorded by the internal GPS or this can be the result of streaming the NMEA strings from an external GPS. |
| PTH |
| Values for the Pressure, Temperature and Humidity sensors. |
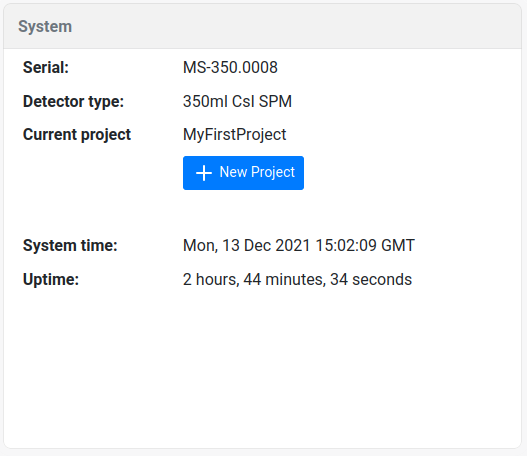
| System |
| System Information. A new project can be created through the button in this box, similar to creating a project on the Projects page. |


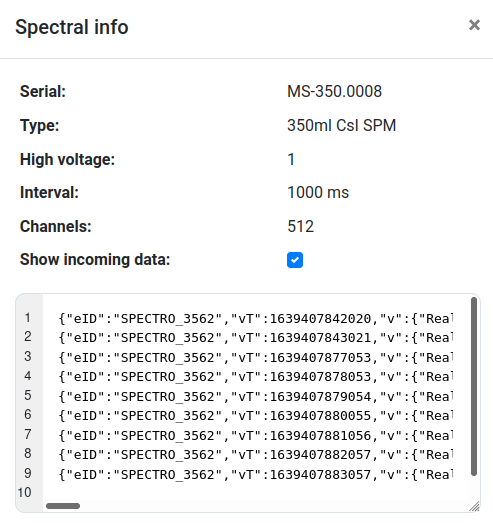
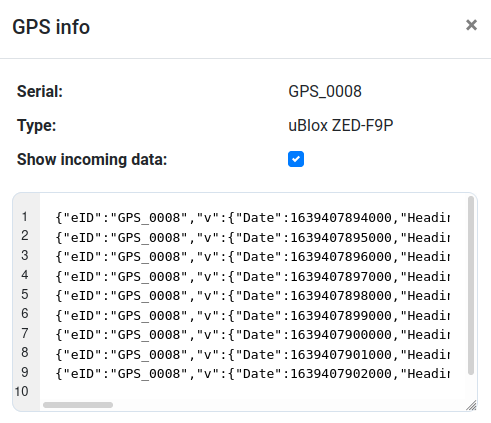
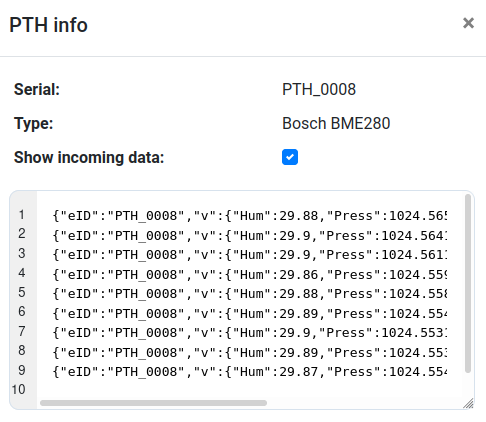
Info boxes
The screenshots below show the data that can be inspected by clicking on the respective icons (
| Spectral info | GPS info | PTH info |
|---|---|---|
|
|
|