
Correction for the different positions of soil moisture and density sensors
Different sensor depths
The RhoC sensor includes an integrated moisture sensor positioned approximately 10 cm below the gamma-based density measurement point. To ensure that soil moisture data is available across the entire depth range of interest, begin your measurement sequence at least 10 cm above the desired depth range. This allows the lower-positioned moisture sensor to capture data that aligns with the full density profile.
During data export, soil moisture content is automatically provided per depth level. Moisture values for intermediate depths are determined through interpolation between individual measurements. In this process, each moisture reading is shifted to align with the center point of the corresponding density measurement, ensuring accurate pairing of moisture and density data per depth.
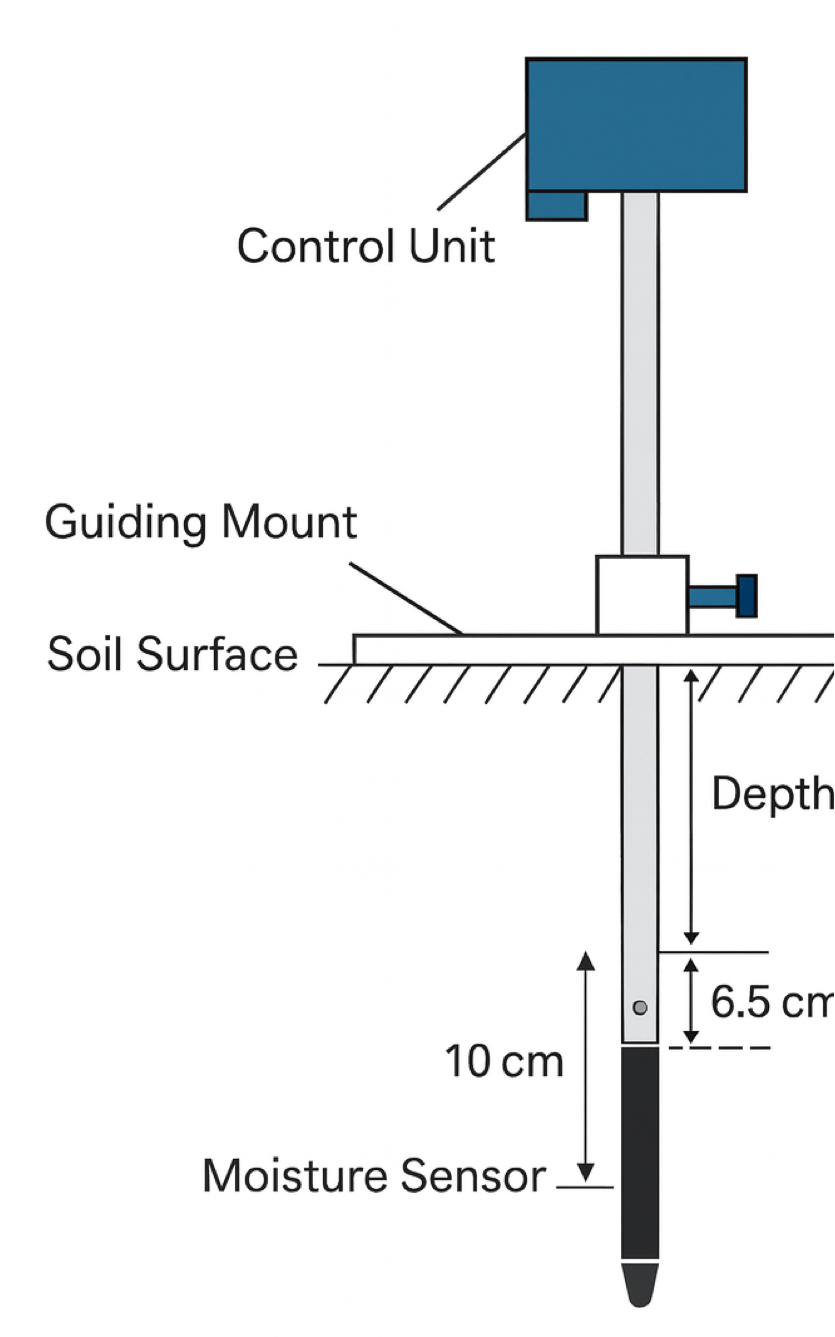
The reported depth corresponds to the center point of the density measurement, measured from the underside of the white guiding mount.
For uppermost density measurements (typically near the soil surface) where no direct moisture measurement is available, the nearest available moisture value is used in the calculation of dry bulk density.
If only one density measurement is taken at a given location, the corresponding moisture value from that depth is used directly for computing dry bulk density.
For best results, it is recommended to start measurements at least 100 mm above the top of the density measurement range, ensuring full moisture coverage.
Example of depth correction
The figures below illustrate measurements taken at 8 cm intervals in soil with a uniform dry bulk density of 1.3 kg/l. Up to a depth of 40 cm, the soil moisture content is 5%. Below this depth, the moisture increases, reaching a maximum of 35% at 50 cm (blue line in Figure 1a). This increase in water content causes the field bulk density to rise between 40 and 50 cm, from 1.35 kg/l to 1.65 kg/l (orange line and dots in Figure 1a).
However, the measured moisture content appears to change between 30 and 40 cm. This apparent shift results from the moisture sensor being located 10 cm below the density measurement point. As a result, the uncorrected moisture values (blue dots in Figure 1a) do not align with the density measurement depths.
To correct for this, interpolation is applied to shift the moisture values upward, aligning them with the center of the corresponding density measurements. The corrected moisture values are shown as blue dots in Figure 1b. This alignment enables accurate calculation of the dry bulk density, as shown by the orange dots in Figure 1b.
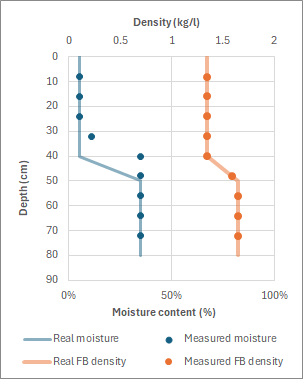 Figure 1a: Measured moisture content (blue dots) before correction of the depth offset and measured field bulk density (orange dots). the solid lines shows the actual value. | 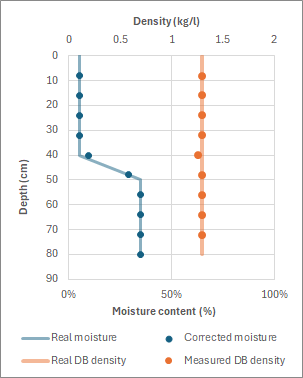 Figure 1b: Corrected moisture content (blue dots) and calculated dry bulk density (orange dots). |
Note that moisture and density measurements will align when the measurements are taken at regular intervals that are exact fractions of 10 cm (10 cm, 5 cm, 3.33 cm (1/3 of 10 cm), 2.5 cm etc). In these cases, the depths of the moisture and density measurements will overlap, ensuring that data from both sensors corresponds directly to the same depths.