
4. Plot
With Gamman it is possible to plot different fields in the dataset against each other. This is a very useful tool for verification of the dataset. When data is plotted, one can use the tag tool to select several data points for removal or because the data is of no interest. The layout of the graph can be changed and the result can be printed. This chapter will describe the plot procedure, explain how tagging can be used, explain the various chart settings which can change the appearance of the graph and finally explain how to print the graph.
4.1 Plot
This chapter will explain how to plot various fields in the dataset against each other. Three fields can be selected (X,Y,Z).
Plot
1. Press the View button to toggle between Spec view and data view. Make sure the plot view is active.
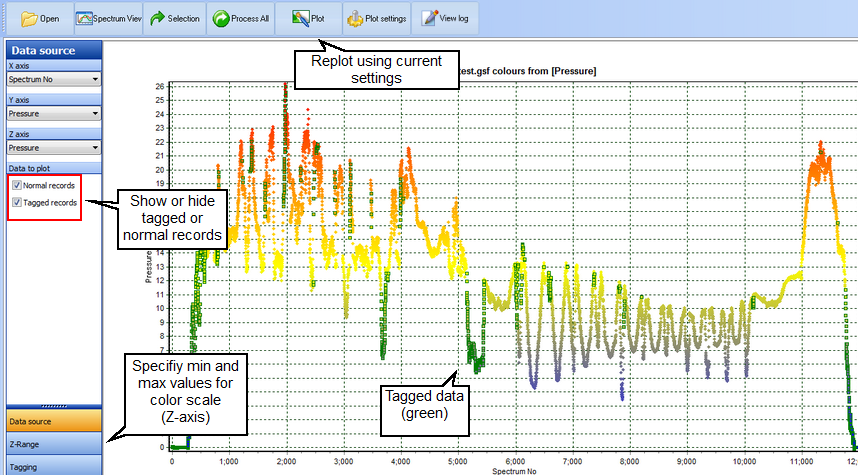
2. Press the Data Source button in the left menu bar to change the X, Y and Z axis. The Z axis is displayed as a color. Low values are blue, high values red.
3. Press the Plot button located in the top menu bar to (re)plot the graph. · Zooming in can be done by dragging the mouse on the graph while holding the left button down, from left to right. Zooming out can be done by doing the opposite. · To pan, shifting the view of the graph, press and hold the right mouse button and drag to the desired direction · To select a data point, move over the point until the cursor changes in a cross hair: Click and the current data point will be selected in the data view table.
4. You can also apply a simple filter. Click on the Data source button in the left menu bar. Two check boxes can be used to turn on or off the normal and/or the tagged records.
5. If you would like to automatically plot using the current settings without having to press the Plot button every time, check the Autoplot checkbox located in Help | Program settings tab Data viewer.
Z-Range
Gamman will automatically use the minimum and maximum values from the dataset for the Z-axis. Sometimes you may want to change this range. This can be done by changing the settings in the Z-Range menu.
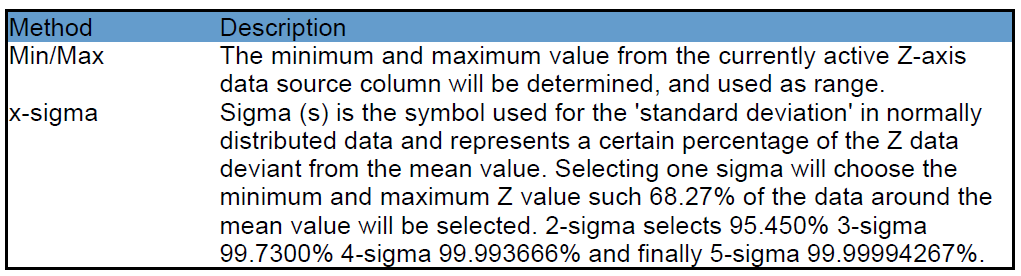
1. Press the Z-Range button in the left menu bar. The minimum and maximum Z value can be changed manually by typing a value in the text box or automatically, by selecting an option from the Method drop down list:
Upon clicking on the
2. Click the Plot button to replot.
4.2 Tagging
Tagging can be used to 'mark' data points. After the points are marked they can be deleted, excluded from the plot or you can just leave them tagged because the data points are of special interest. Tagging can be done in the raw and the processed data, tags are stored in the Gamman Survey File. There are two procedures to tag records. One can tag directly from the data viewer table or by drawing a polygon around the points in the plot view.
Tagging using the data viewer
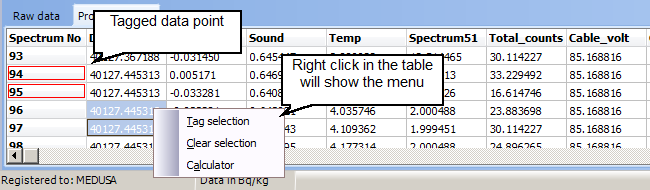
1. Select the desired data points in the data viewer. You can select multiple items by holding the left mouse button and dragging up or down in the list. To select all items in the table press CTRL + A.
2. Press the right mouse button and select Tag selection. The current selection is tagged, by default indicated with a red color. The color can be changed in the Program settings.
3. If you would like to undo the tagging, reselect the items, press the right mousse button and select Clear selection. All records for the currently active table can be untagged with the Clear all tags option.
4. The tag commands can also be accessed from the File menu by pressing the Edit button
Tagging data points with a polygon
1. Tagging with a polygon is done in the plot view. Press the View button to toggle from the data view to the plot view.
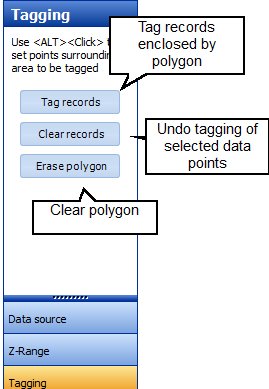
2. Select the Tagging item from the left menu bar.
3. Hold the Alt-key while clicking the desired points in the plot view. Enclose the data points as indicated below.
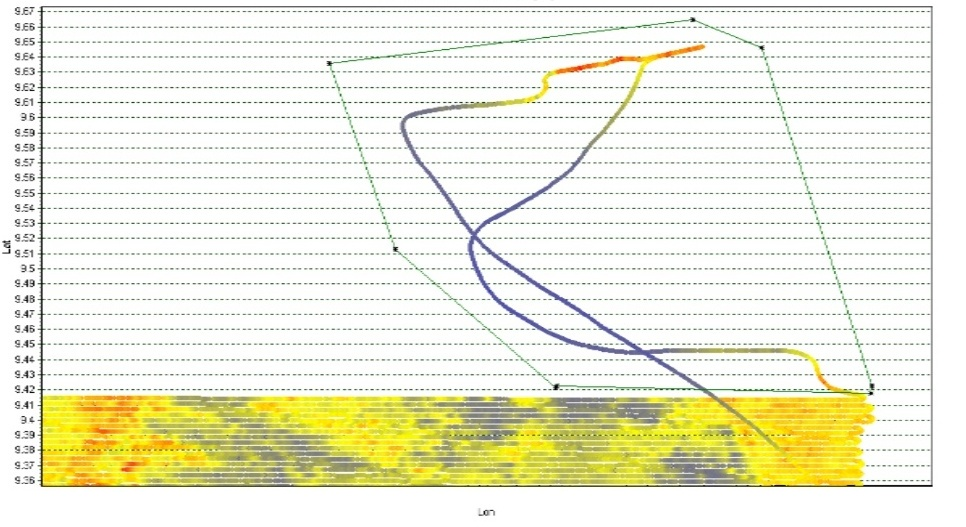
4. Press the Tag records button in the Tagging menu to tag the current selection.
4.3 Printing a graph
You can print the various graphs produced in Gamman from the spectral view or from the plot view. This chapter will discuss how to print graphs and how to copy them to the clipboard.
Printing a graph
1. To print the current view displayed on your screen, open the the Chart editor which can be found in the Plot settings menu bar. This editor can be used in the plot view and in the spectral view.
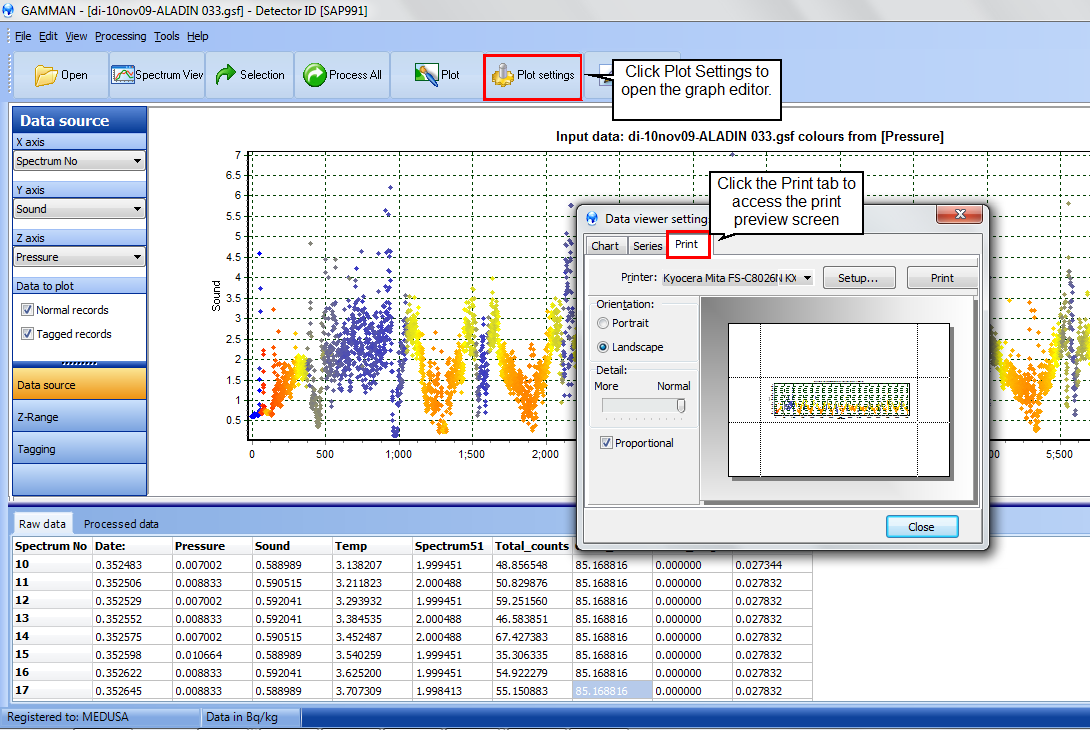
2. The Chart editor dialog appears. Click on the tab Print to access the print preview.
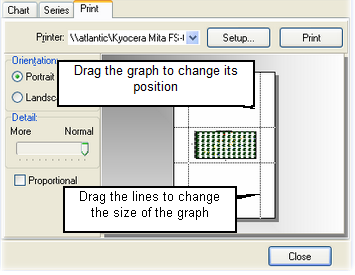
The layout of the graph can be changed in this window. To change the position of the graph, hover over it in the print preview screen. The cursor will change in a hand

3. Click the Print button to print the current layout.
Copy a graph to the clipboard
Instead of printing your current layout you can also copy it to the clipboard. Again this can be done from the spectral view and from the plot view.
1. To copy your current spectral or plot view. Click Edit | Copy chart