
5. Fitting schemes
Processing data in Gamman is the step where measured gamma spectra will be analysed, which result in a set of activity concentrations. When processing data in Gamman, you have to select one of the available fitting schemes. When performing a moving measurement, the fitting scheme you choose, and the options you select have an effect on the accuracy of the activity concentrations and on the spatial resolution of the data.
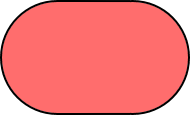
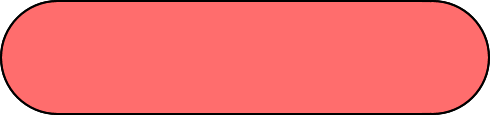
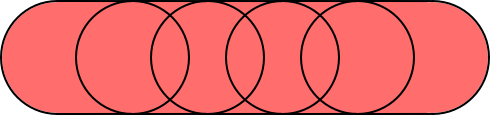
A spectrometer collects data not from a point, but from an area surrounding the spectrometer. For a carborne measurement, data can be collected easily from a circle with a radius of 3 meters or more. For an airborne measurement, the circle is much larger and can be over 100 meters, depending on the altitude of flight. While performing a moving measurement, the circle moves along with the spectrometer, resulting in a covered area as shown in the figures below.
 |
 |
 |
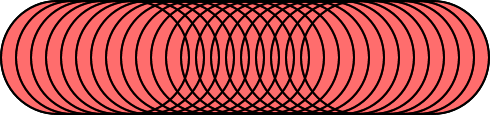 |
| Figure 1: The area contributing to the recorded gamma spectra during a moving measurement. The circle shown has a radius of 5 meter, speed during the measurement is 4 m/s (14.4 km/h). A: The area contributing to a single measurement of 1 second; B: The area contributing to a single measurement of 5 seconds; C: The effect of combining 5 measurements of 1 second each; D: Similar to C, but with 0.2 seconds per measurement. | |
5.1 Fitting schemes
As you can see from figures 1A and 1B, read-out frequency has an effect on the area covered while recording a gamma spectrum. Increasing the measurement period results in a larger area covered, which is often undesired. However, shorter measurement time will result in larger uncertainties. Gamman allows for combining multiple spectra through the Process dialog.
Fit each
Each individual spectrum will be processed separately.
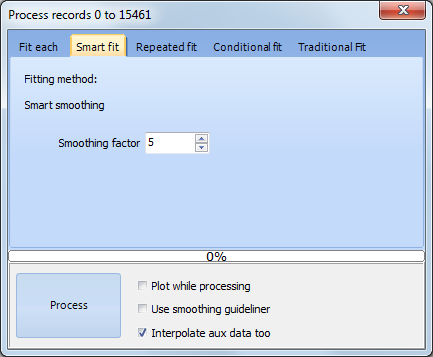
Smart fit
 |
|---|
| Figure 2: Processing dialog in Gamman, showing the Smart fit options. |
Combines spectra before analyzing the data. The smoothing factor determines how many spectra will be combined. A smoothing factor of 5 for spectra recorded at 1 Hz results in 5 seconds of data being combined for analysis. The same area recorded at 5 Hz would require a smoothing factor of 25 to get the same results. The Smart fit performs a running average, it first combines spectra 1 to 5, then 2 to 6 etc. Auxiliary data, such as GPS position is averaged.
Repeated fit
Much the same as the Smart fit, but does not overlap analysis intervals. When combining 5 spectra, Gamman will first combine spectra 1 to 5, then 6 to 10 etc.
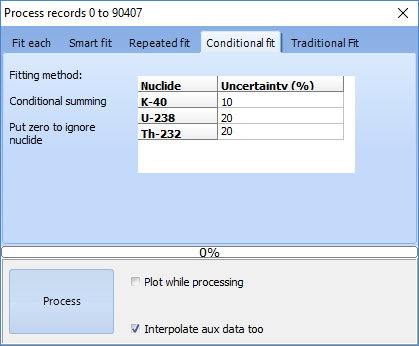
Conditional fit
 |
|---|
| Figure 3: Processing dialog in Gamman, showing the Conditional fit options. |
This fitting scheme will combine spectra until all required uncertainties are being met.
Traditional fit
Performs a traditional 3 windows analysis, where all other fitting schemes use the more advanced full spectrum analysis. It is mentioned on the page for reference only.
5.2 Summary
Fitting schemes allow for combining gamma spectra. Combining more gamma spectra results in more accurate nuclide concentrations, at the cost of spatial resolution.
See also
9. Statistical uncertainties in nuclide concentrations - what good are they for?
8. On accuracy and spatial resolution