
9. Statistical uncertainties in nuclide concentrations - what good are they for?
One of the things Gamman calculates when doing full spectrum analysis, are the uncertainties in the radionuclide concentrations found. These uncertainties are listed in the processed data, in the columns labeled s_K, s_U, etc. Why are these numbers important? Well, basically because they give a direct clue about your data quality. For instance they allow to decide wether you have taken enough records in the running average fitting of the data.Below we'll explain why.
9.1 Uncertainties, how to interpret them?
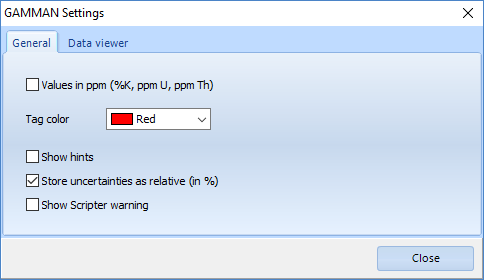
In Gamman, the uncertainties can be listed as absolute numbers (in Bq/kg or ppm, depending on the program settings), or as relative numbers (%). This choice can be made in the Gamman settings:
Either way, the uncertainties tell you something about the nuclide concentration. Take, for instance the data snippet (taken from Gamman) below:
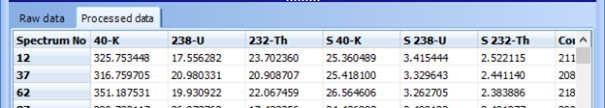
The toprow (spectrum 12) gives us for instance a 40K value of (325 ± 25) Bq/kg. For 232-Th the value is (24 ± 2.5) Bq/kg. In other words: the uncertainty in the K concentration in this case is about 7%. In 232-Th it is about 10%. So, in this specific case the data quality (in terms of the uncertainty of the nuclide concentrations found) is about 10%. This tells you that - if you would do a series of measurements at the same spot in the field, you would find K, U and Th values spreading around some mean value within a bandwidth of about 10%.
For those interested, the spread in the nuclide concentrations is described by so-called Poisson statistics - check for instance https://en.wikipedia.org/wiki/Poisson_distribution. Poisson statistics basically states that the uncertainty ("error") in a single measurement is equal to the spread in a large series of the same measurement done over and over. Gamman actually allows to check that, by selecting a large range of records (in a static measurement). If you now open the project log box (knob "view log" on the menu bar):
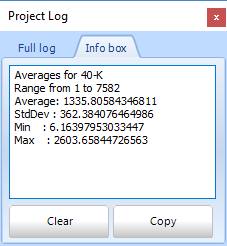
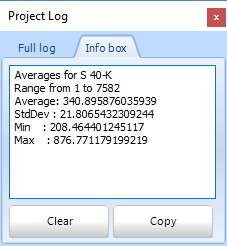
The 1st box shows the average 40K value (1335 Bq/kg) and the spread around this average (362 Bq/kg). The 2nd box shows the average uncertainty for the same data (340 Bq/kg). As you see here, the spread in all datapoints indeed confirms the uncertainties calculated by Gamman.
9.2 Uncertainties, how to use them?
Since we now understand what these uncertainties imply, how can we use them to decide on processing steps? Well Gamman helps you out. If you select a spectrum row in Gamman ("raw data" tab), the program instantly calculates the K, U and Th values, and also the associated uncertainties. In the image below, we have selected spectrum 20. In this case we are looking at 5Hz data taken with an MS-2000 (click on the pic to enlarge):
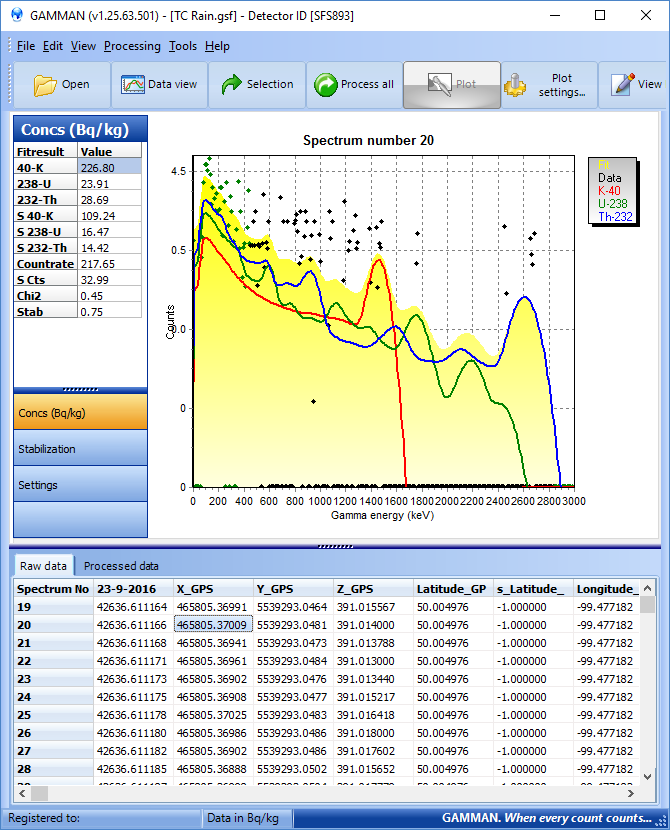
As you can see, selecting a single spectrum gives us an uncertainty in the 40-K of about 50% (here 40-K is 226 ± 109 Bq/kg). If you now select 10 rows (virtually creating a summed spectrum of 2 seconds) you get the image below:
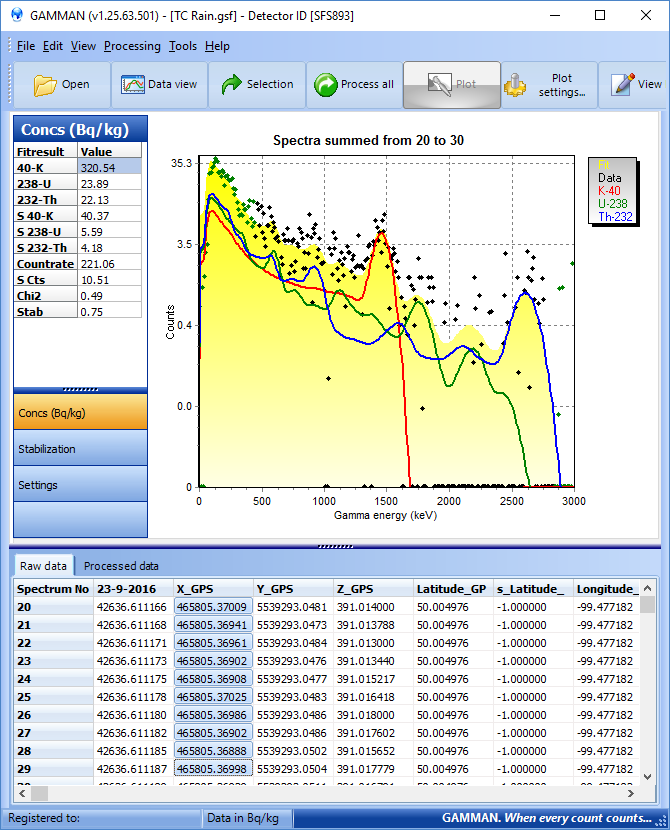
Two things immediately become apparent:
- The spectrum looks a lot more like a ehhh...spectrum!
- The uncertainty in the 40-K is reduced to about 12%
If we would now further increase the size of the selection, the uncertainty will be even further reduced. Lets take 50 records (10s data):
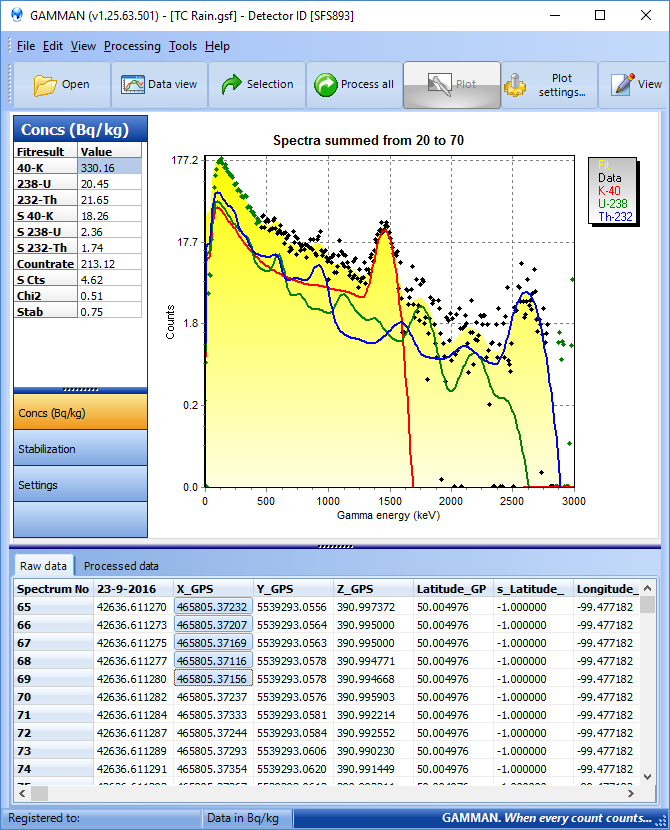
Even nicer spectrum! And the uncertainty gets reduced to about 5%
9.3 The moral of this story?
Uncertainties are a very important means of helping you to decide how many records you should use in the running average in Gamman, if you want to guarantee a certain quality in the nuclide concentrations. If you add records, the uncertainty becomes lower. It can even be shown, mathematically, that the lowering of the uncertainties goes with the square root of the number of records you integrate - this also follows from the Poisson statistics mentioned before.
However, you should always keep in mind that increasing the number of records will also have an effect on the spatial resolution of the data. Summing data basically implies getting better nuclide data at the expense of spatial resolution.
9.4 Can't this be automated?
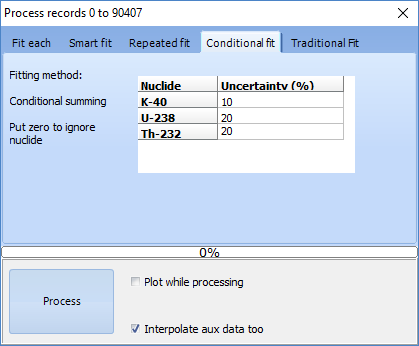
Gamman has a nice feature that allows you to define the max uncertainty you accept, before running the full spectrum analysis! Under the tab "Conditional Fit" in the process data box, you can pre-set uncertainties you whish to get. The software will then integrate so many records needed as to get down to the uncertainties you want:
Just have a try!
See also
- 5. Fitting schemes in Gamman