
6. Process data
Processing data will calculate the nuclide concentrations, this calculation is based on the fitted curve as discussed in the chapter on stabilization. The processing data menu provides several 'fitting schemes' which can be applied to the raw spectra. The fitting schemes improve the fit results by using variance reduction or averaging the raw dataset. After processing the data, the results can be exported to a CSV file.
6.1 Process data
Five fitting schemes can be used in Gamman. A fitting scheme sums records in various ways to get more accurate nuclide concentrations. This chapter explains how to use the fitting schemes.
Processing data
1. Press the "Process all" button in the top menu bar to open the process dialog and process all raw data. You can also select records from the raw data table and process only this selection by clicking the "Selection" button.
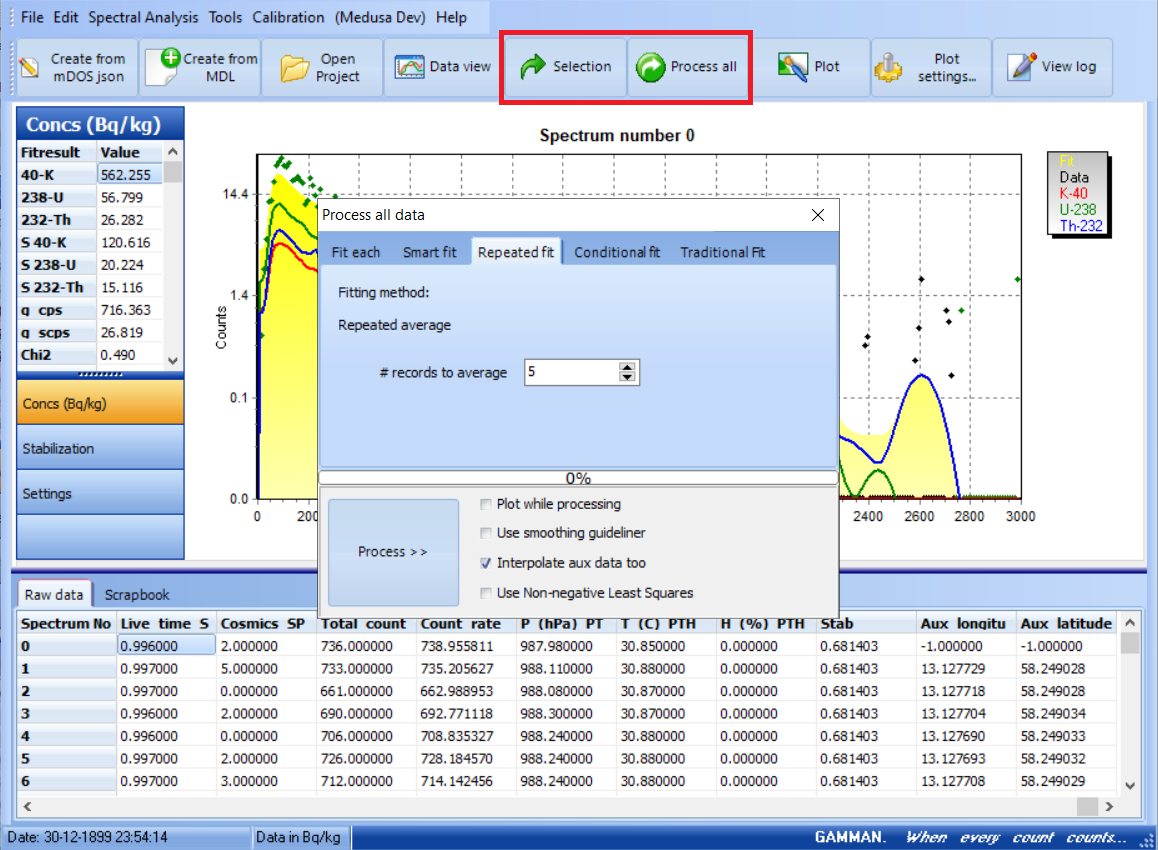
2. Choose one of the fitting schemes listed. In the Reference, a description of each fitting scheme is enclosed.
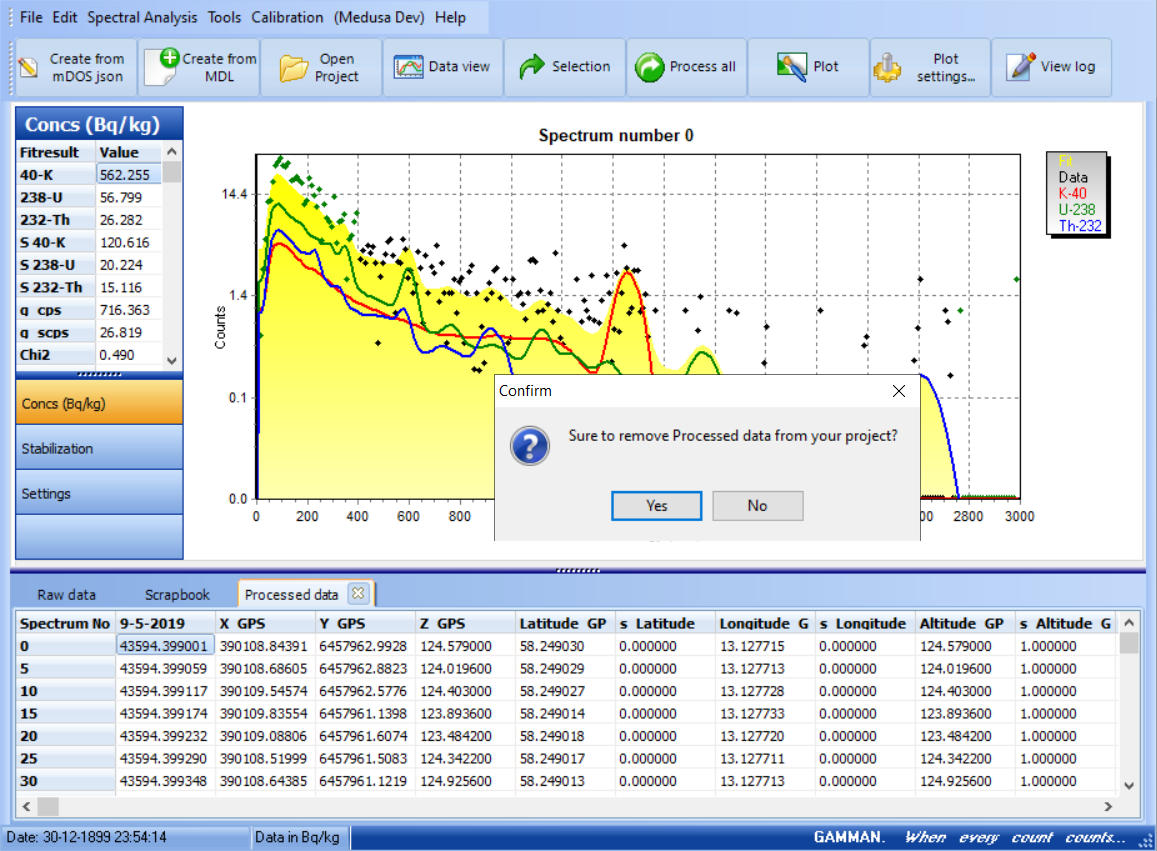
3. Processing data will apply the specified fitting method on the raw data and create a new table containing the results, the processed data. You can switch between these two by pressing the tabs in the data viewer table.
4. Processing will only include data which is not tagged.
5. With the option Spectral analysis | Average and fit selection you can average the selected raw data records into one record. This can be useful in, for example, point measurements. It is quickly accessible by pressing Ctrl+F. This averaged record is then added to the "Scrapbook" tab of the data.
6. Processed data can also be removed by clicking on the cross on one of the data tabs.
6.2 Export results
The raw and processed data table and spectrum (energy stabilized and raw) can be exported as a Comma Seperated File CSV. After this, the file can be opened in for example a GIS tool for further processing.
Export data
1. To export data click on File | Export with template
2. A new window pops up, where you can select which data you want to export.
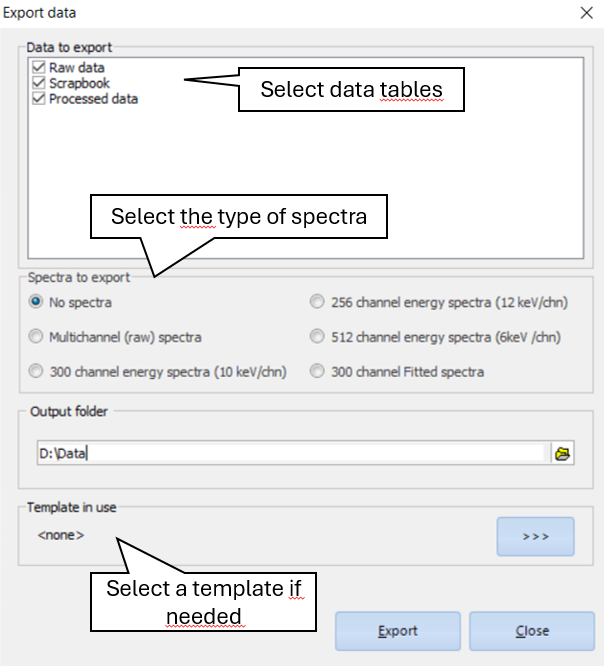
In this window, you can select the tables with data that you want to export. These are the same columns that you see in the data window on the bottom of the screen in Gamman. Additionally, you can choose if you want to export raw spectra or stabilized spectra. You can include or exclude the tagged data, if tagged data is included it can be identified with the column 'TAGGED'.
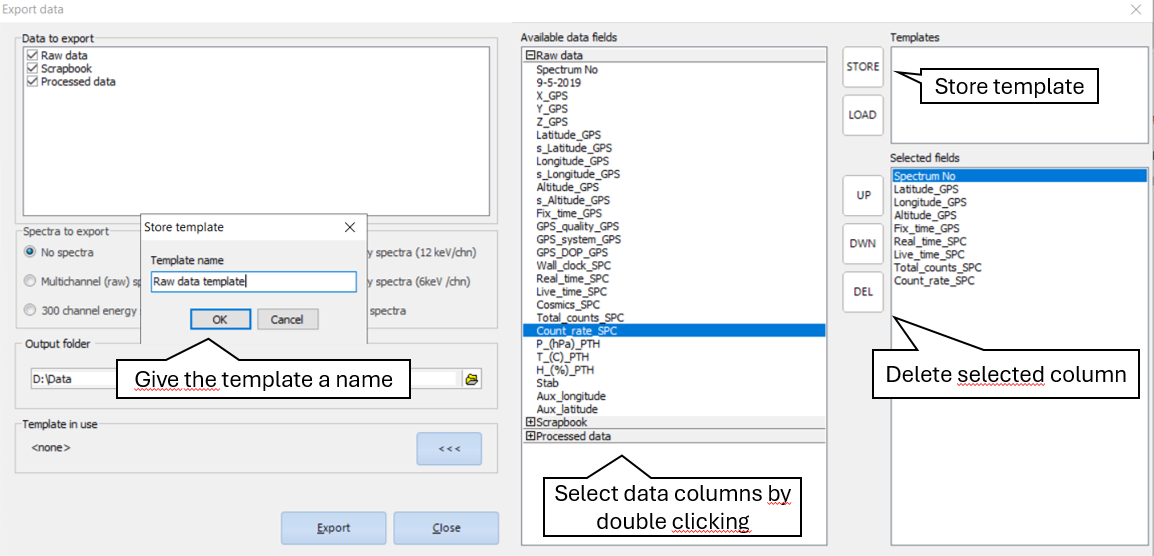
There is also an option to create a template. To make a template, click on the ">>>" button where data fields of the different tables can be selected. Double click on the data field that you want to export when using this template. This field will appear on the "Selected fields" window. Here, they can be rearranged and also deleted by selecting a field and clicking on "DEL". When the template is done, this can be saved by clicking on "STORE". Give the template a name and you can use it for future data exports.
{}