
Quick Start Guide
Goal: Power on your Medusa detector and complete a first measurement.
Time required: approximately 15–20 minutes, including stabilisation.
Before You Start
Your Medusa spectrometer contains a scintillation crystal at its core. It is a sensitive instrument — handle it with care and avoid dropping or impacting the housing. The detector ships with a shock-absorbing layer around the crystal, but this does not protect against heavy impacts or falls.

UAV users: Before mounting the real detector under a drone, always test your platform with a dummy weight of the same mass. Drones operating near their maximum payload can behave unpredictably due to frame flex, vibration, or magnetic interference from GPS antennas. Medusa recommends confirming platform stability with a dummy before any flight with the spectrometer.
If you have questions about mounting, cabling, or compatibility, contact Medusa support before proceeding.
Step 1 — Mount the Detector
The detector's end caps have mounting points that can support the full weight of the unit when properly fastened. Mounting dimensions differ between systems; refer to the technical datasheet for your model. Preferably use one of the mounting plates provide by Medusa.

Orientation: Gamma radiation is detected from all directions. There is no preferred axis — mount the detector in whichever orientation suits your platform best. The only rule is to minimise material between the detector and the ground: avoid placing dense objects (batteries, metal brackets) directly between the sensor and the soil.
Connectors
All Medusa systems are fitted with an arctic grip Lemo connector designed for outdoor use. This connector provides power to the sensor, and optionally an ethernet and RS-232 connection.
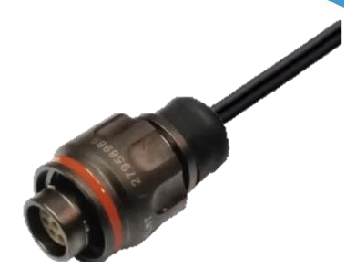
On the front cap of the detector, also you will see a WiFi and a GPS interfaces.
Connection | Antenna / Cable | |
|---|---|---|
WiFi | Medusa detectors have embedded Wi-Fi antenna dome | |
GPS (MS-20K / MS-4000 / MS-2000 / MS-7300) | JCA228F GNSS Surveying Antenna with a SMAmale to SMA male cable | 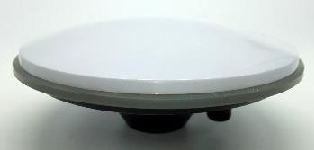 |
GPS (MS-1000 / MS-700 / MS-350) | Active/Passive SMA male GPS antenna | 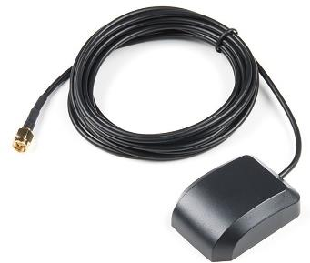 |
Medusa Uplink (MS-100) | Ethernet | 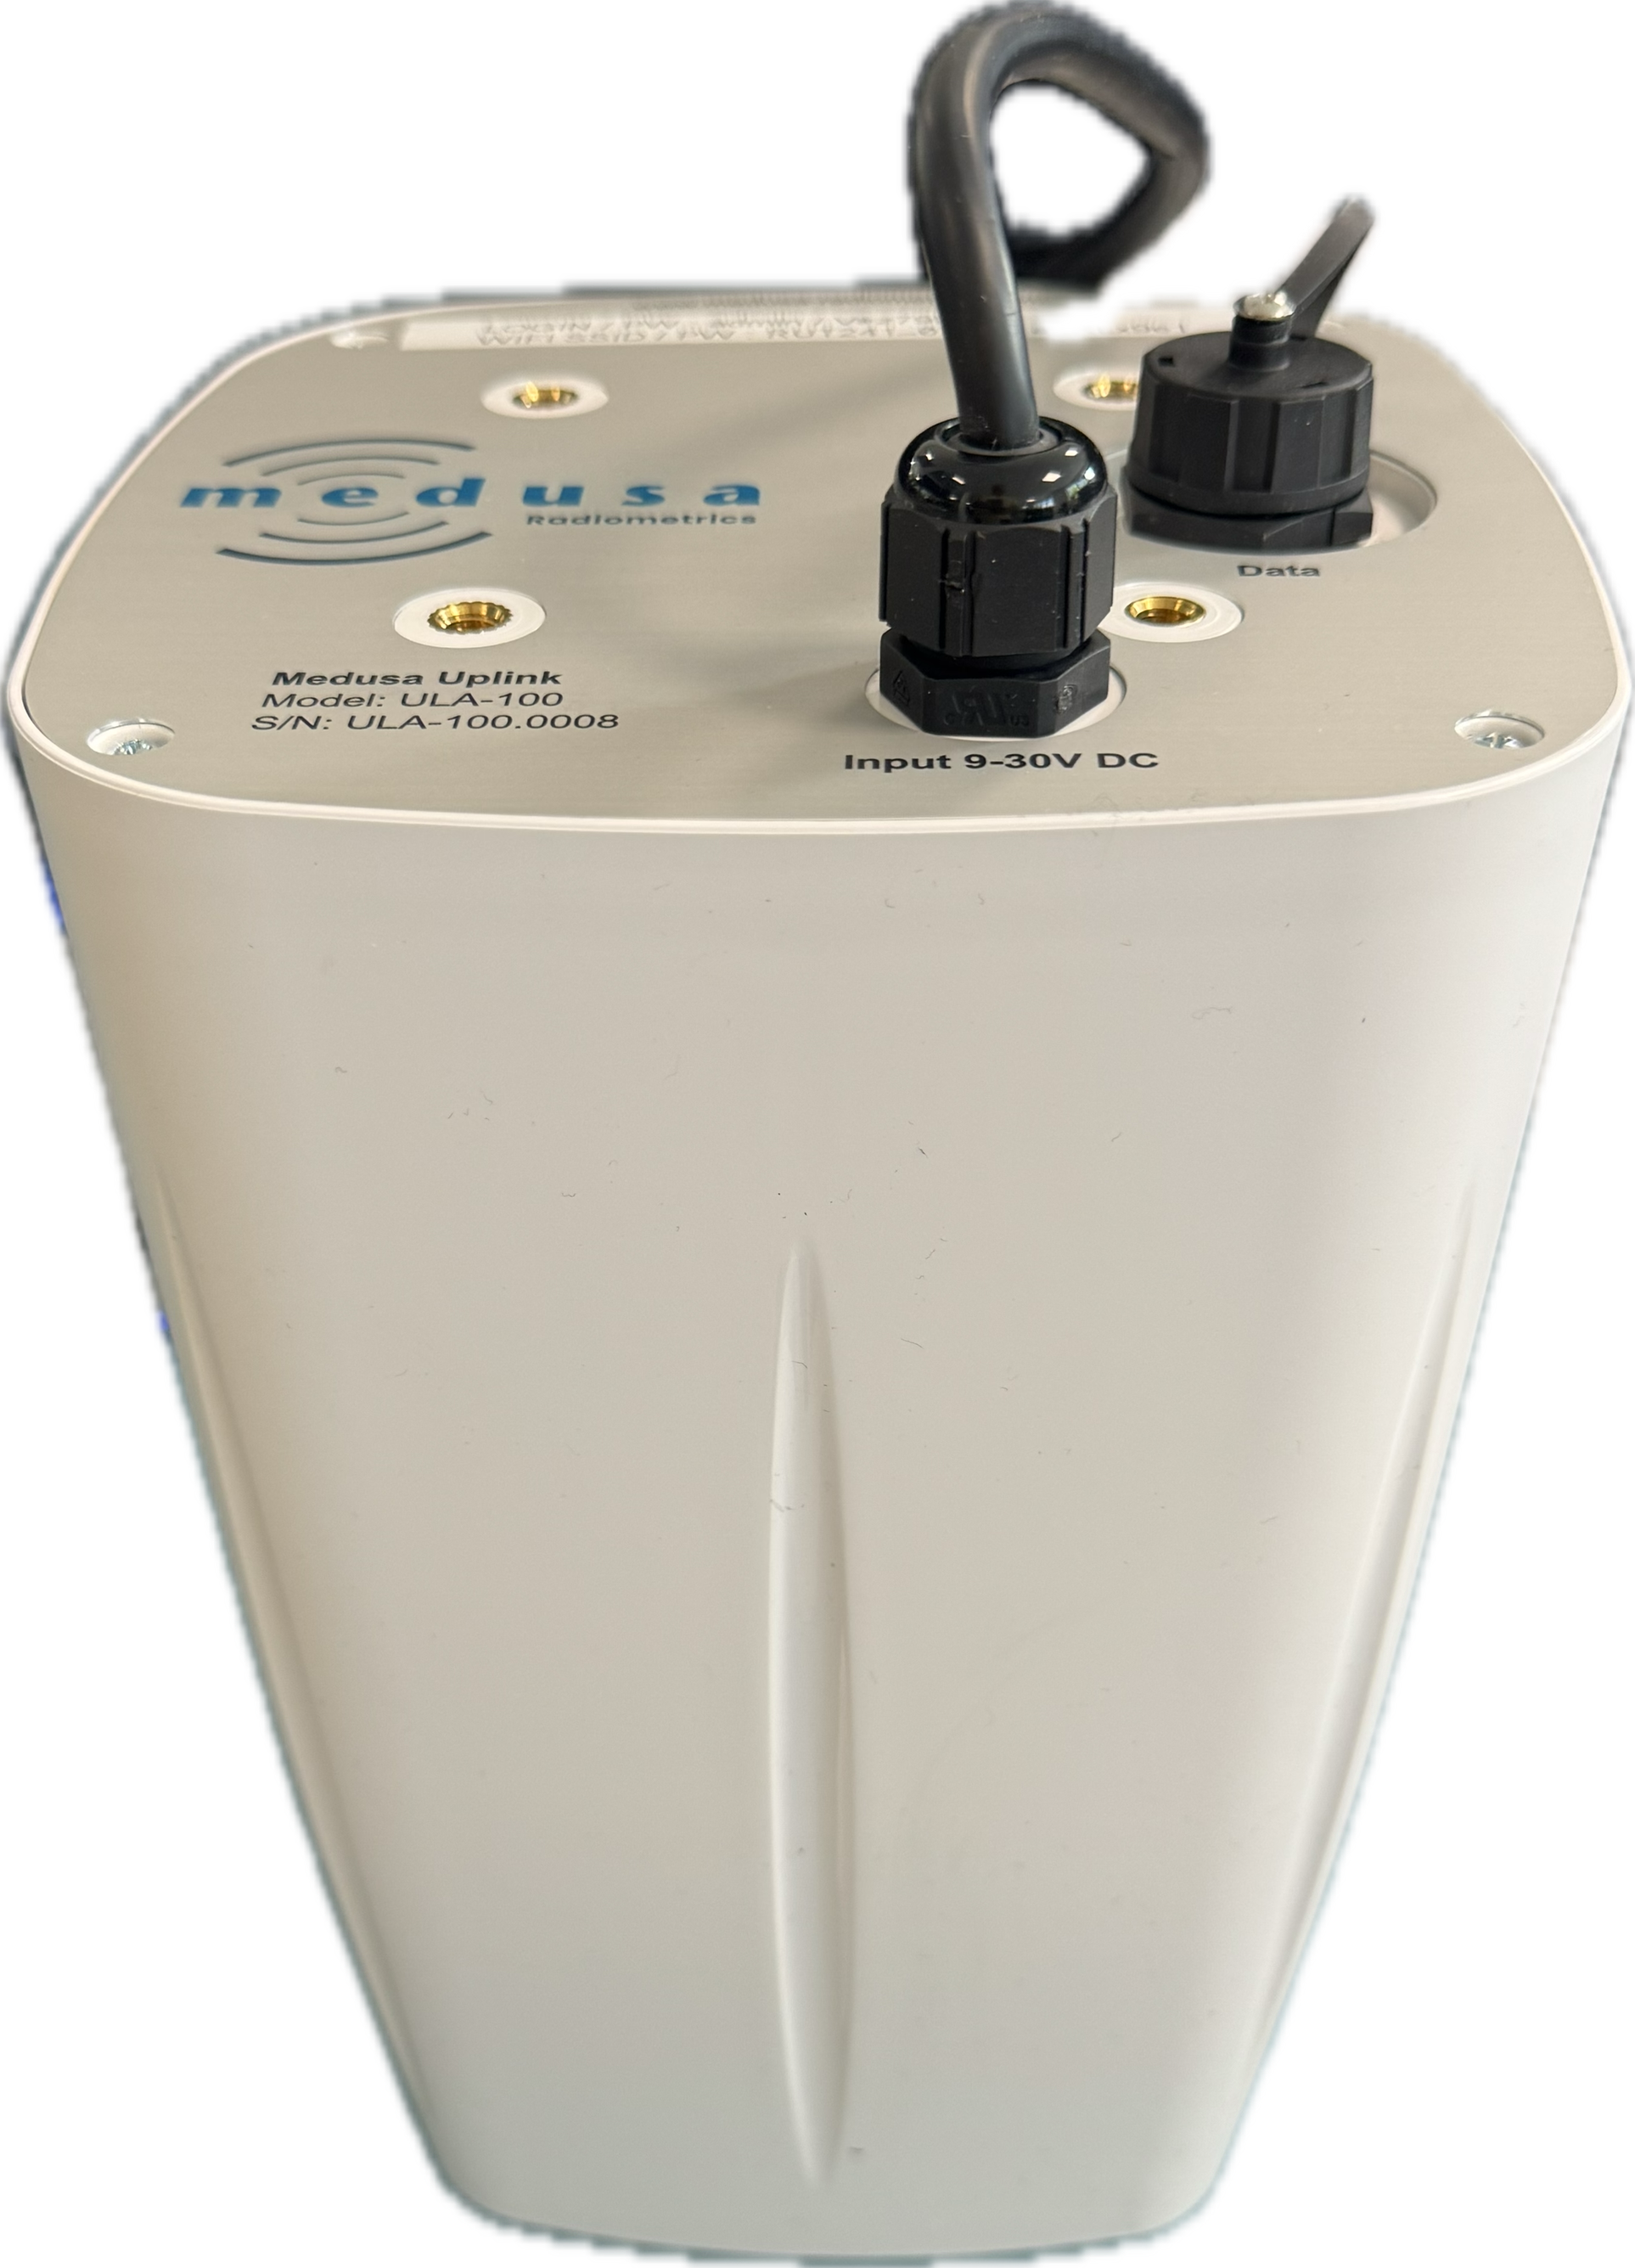 |
Detector – Connection Box | Lemo (MDC-60x cable) | 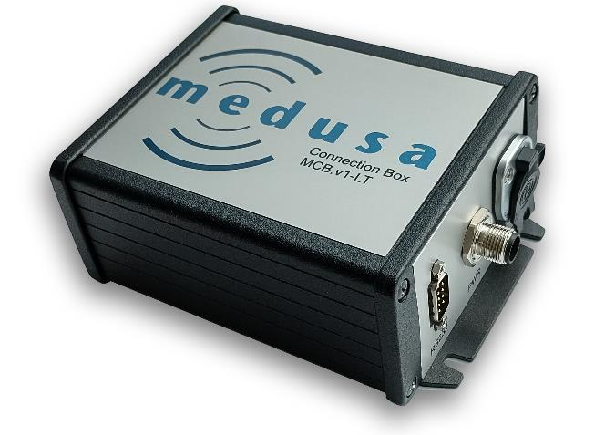 |
Ethernet | Standart UTP | |
RS-232 | DB-9 | |
Power | TE connectivity M12 female 3Pin | |
Step 2 — Connect Power
Medusa supplies a cable matched to your detector model. Always use Medusa-certified cables — they are designed to protect the internal electronics from voltage spikes and reversed polarity.
Detector model | Cable | Input voltage range | Connector types |
|---|---|---|---|
MS-20K / MS-4000 / MS-2000 / MS-7300 | MDC-40x | 9–18 V or 9–35 V | Ethernet + flying leads (power) |
MS-1000 / MS-700 / MS-350 / MS-100 | MDC-50x | 5–35 V | USB (power) |
Power requirements: The spectrometer draws 3 W continuously and up to 6 W at peak. Your power source must supply at least 1.2 A at 5 V (for USB-powered models) or the equivalent at the supplied voltage. Most field power banks are suitable. A standard computer USB port is not — it cannot reliably deliver the required current.
Once the cable is connected and power is applied, the detector starts up automatically. No power switch needs to be operated.
Detector handle: An optional accessory for the MS-350, MS-700 and MS-1000 is the detector handle, containing a battery lasting up to 12 hours provides an easy way to carry the sensor around.
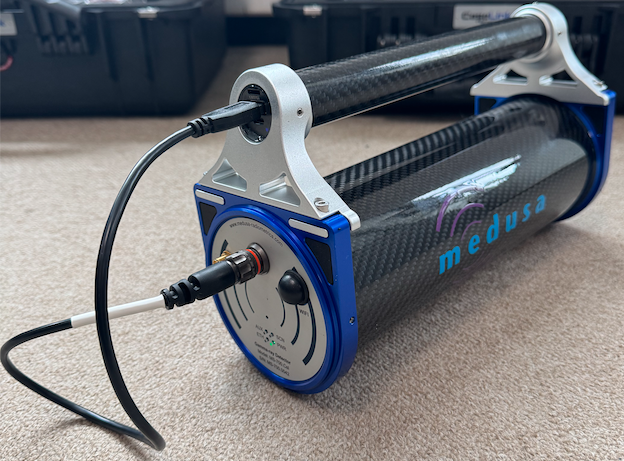
Remove the handle via the four M4 screws between the blue detector caps and the aluminium handle.
Step 3 — Check the LEDs
Four LEDs on the detector housing give you an immediate status overview without opening a browser. Check them within the first minute of powering on.
LED | Colour | Meaning |
|---|---|---|
PWR | Green | Input voltage is OK |
| Red | Input voltage is too low |
| Red blinking (1 Hz) | Input power could not be measured |
| Blue | Input voltage is too high — internal electronics may be at risk |
| Purple | Input voltage has large fluctuations — check the power supply |
ETH | Green | Connected to a network (Ethernet or Wi-Fi) |
| Blue | Connected to a network with active internet access |
SCN | Yellow | A raw spectrum is being collected |
| Green | A spectrum has been stabilized, analysed, and stored |
AUX | Yellow | A PTH reading is collected and stored |
| Green | A GPS reading is collected and stored |
| Blue | An auxiliary reading is collected (external sensor) |
During a normal survey: PWR green, SCN blinking green / yellow, AUX blinking.
Storage warning: If both SCN and AUX blink red simultaneously, internal storage is almost full. By default, the detector will begin overwriting the oldest data once storage is completely full. Download your projects before this happens.
Step 4 — Connect to mDOS
mDOS is the detector's built-in web interface. It runs on the detector itself — no software to install. Open any modern browser (Chrome, Firefox, Edge, Safari) on a laptop, tablet, or phone.
Quickest method: WiFi Direct
The detector broadcasts its own WiFi access point. This requires no router or network infrastructure and is the recommended method for field use.
Network name (SSID) |
|
Password |
|
Address in browser |
|
On your device, open the WiFi settings and connect to the detector's network.
Open a browser and go to
192.168.3.1.The mDOS interface loads — no login required.
Phone or tablet: If the page does not load, turn off mobile data. When both WiFi and cellular data are active, some devices route traffic over the cellular network instead of the detector's WiFi.
No internet access: When connected via WiFi Direct, your device is on an isolated network hosted by the detector. Background map tiles in the Survey and Review pages will not load. To use background maps in the field, connect the detector to a phone hotspot via Settings → WiFi → External WiFi (see the mDOS V4 manual, Chapter 5).
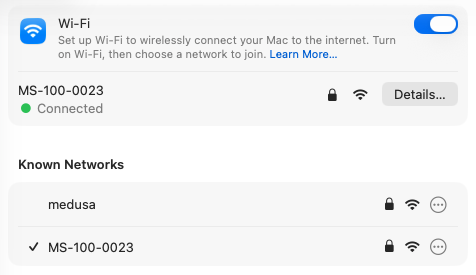
Device WiFi settings showing the detector SSID in the available network list
Alternative: Ethernet Direct
Connect the detector to a laptop using an Ethernet cable.
Address in browser |
|
Laptop network adapter | Set to a fixed IP in the |
This is the most stable connection method and is recommended for critical operations, when there is a lot of interference of other signals or when the sensor is part of a multi-sensor setup.
Step 5 — Check the Dashboard
When mDOS first loads, you land on the Dashboard. This is your pre-survey checklist — check it every time before starting a measurement.
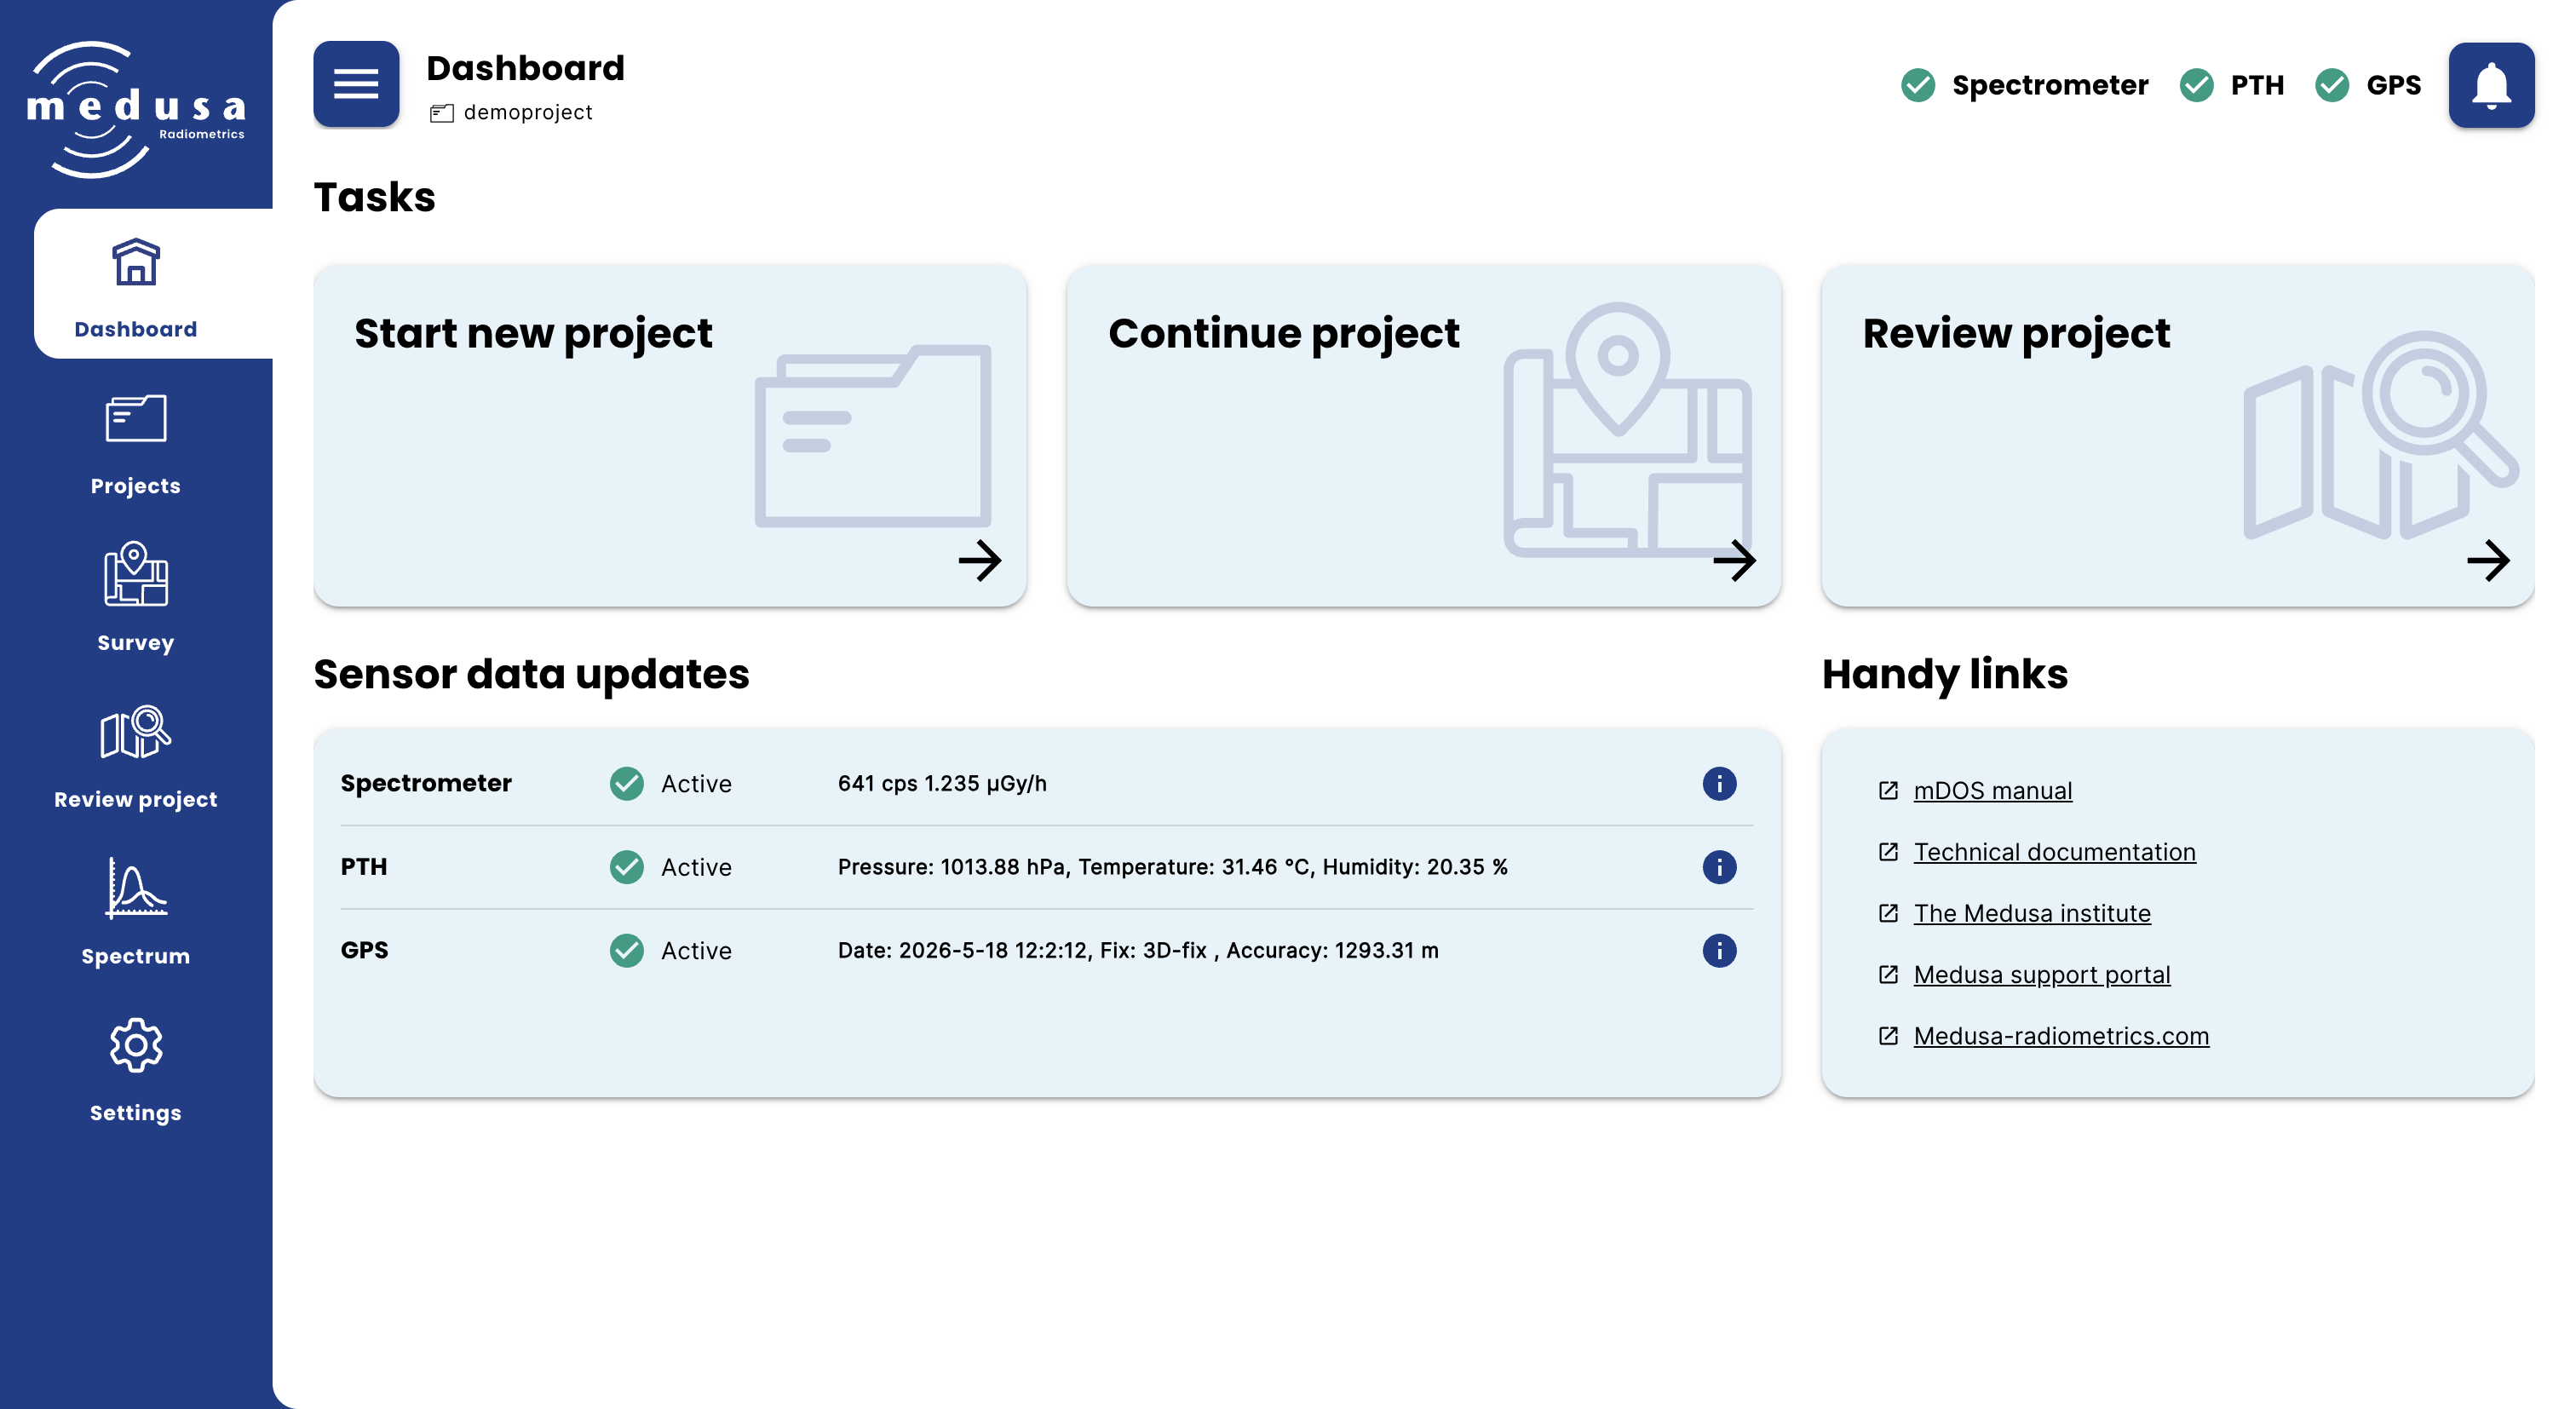
Full mDOS Dashboard showing the spectrometer, GPS, and PTH sensor lines in a normal healthy state
The header bar at the top of every page shows:
Active project — the project all new data is currently being recorded into
Spectrometer status — yellow "Stabilizing (x%)" during self calibration, green badge once complete
GPS status — green badge when a valid position fix is available
PTH status — green badge when the pressure/temperature/humidity sensor is active

mDOS header bar showing the active project name, a stabilized spectrometer badge, green GPS badge, and green PTH badge
Wait for Energy Stabilisation
When the detector first powers on, the spectrometer runs an automatic energy stabilisation process. It accumulates counts across the spectrum and corrects for temperature-dependent drift. This typically takes 3–10 minutes depending on crystal size and background activity.
Until stabilisation is complete, radionuclide concentration values are not valid. The header shows "Stabilizing (x%)" — wait until the percentage reaches 100% and the spectrometer badge turns green before starting a survey.
In very low-activity environments (aircraft, shielded rooms) stabilisation takes longer. In normal outdoor conditions on soil, the process completes in a few minutes.
Step 6 — Create a Project
All measurements are stored inside a project. Before starting your survey, create a new project or confirm the active one is correct.
From the Dashboard, click Start new project, or navigate to the Projects page in the left sidebar.
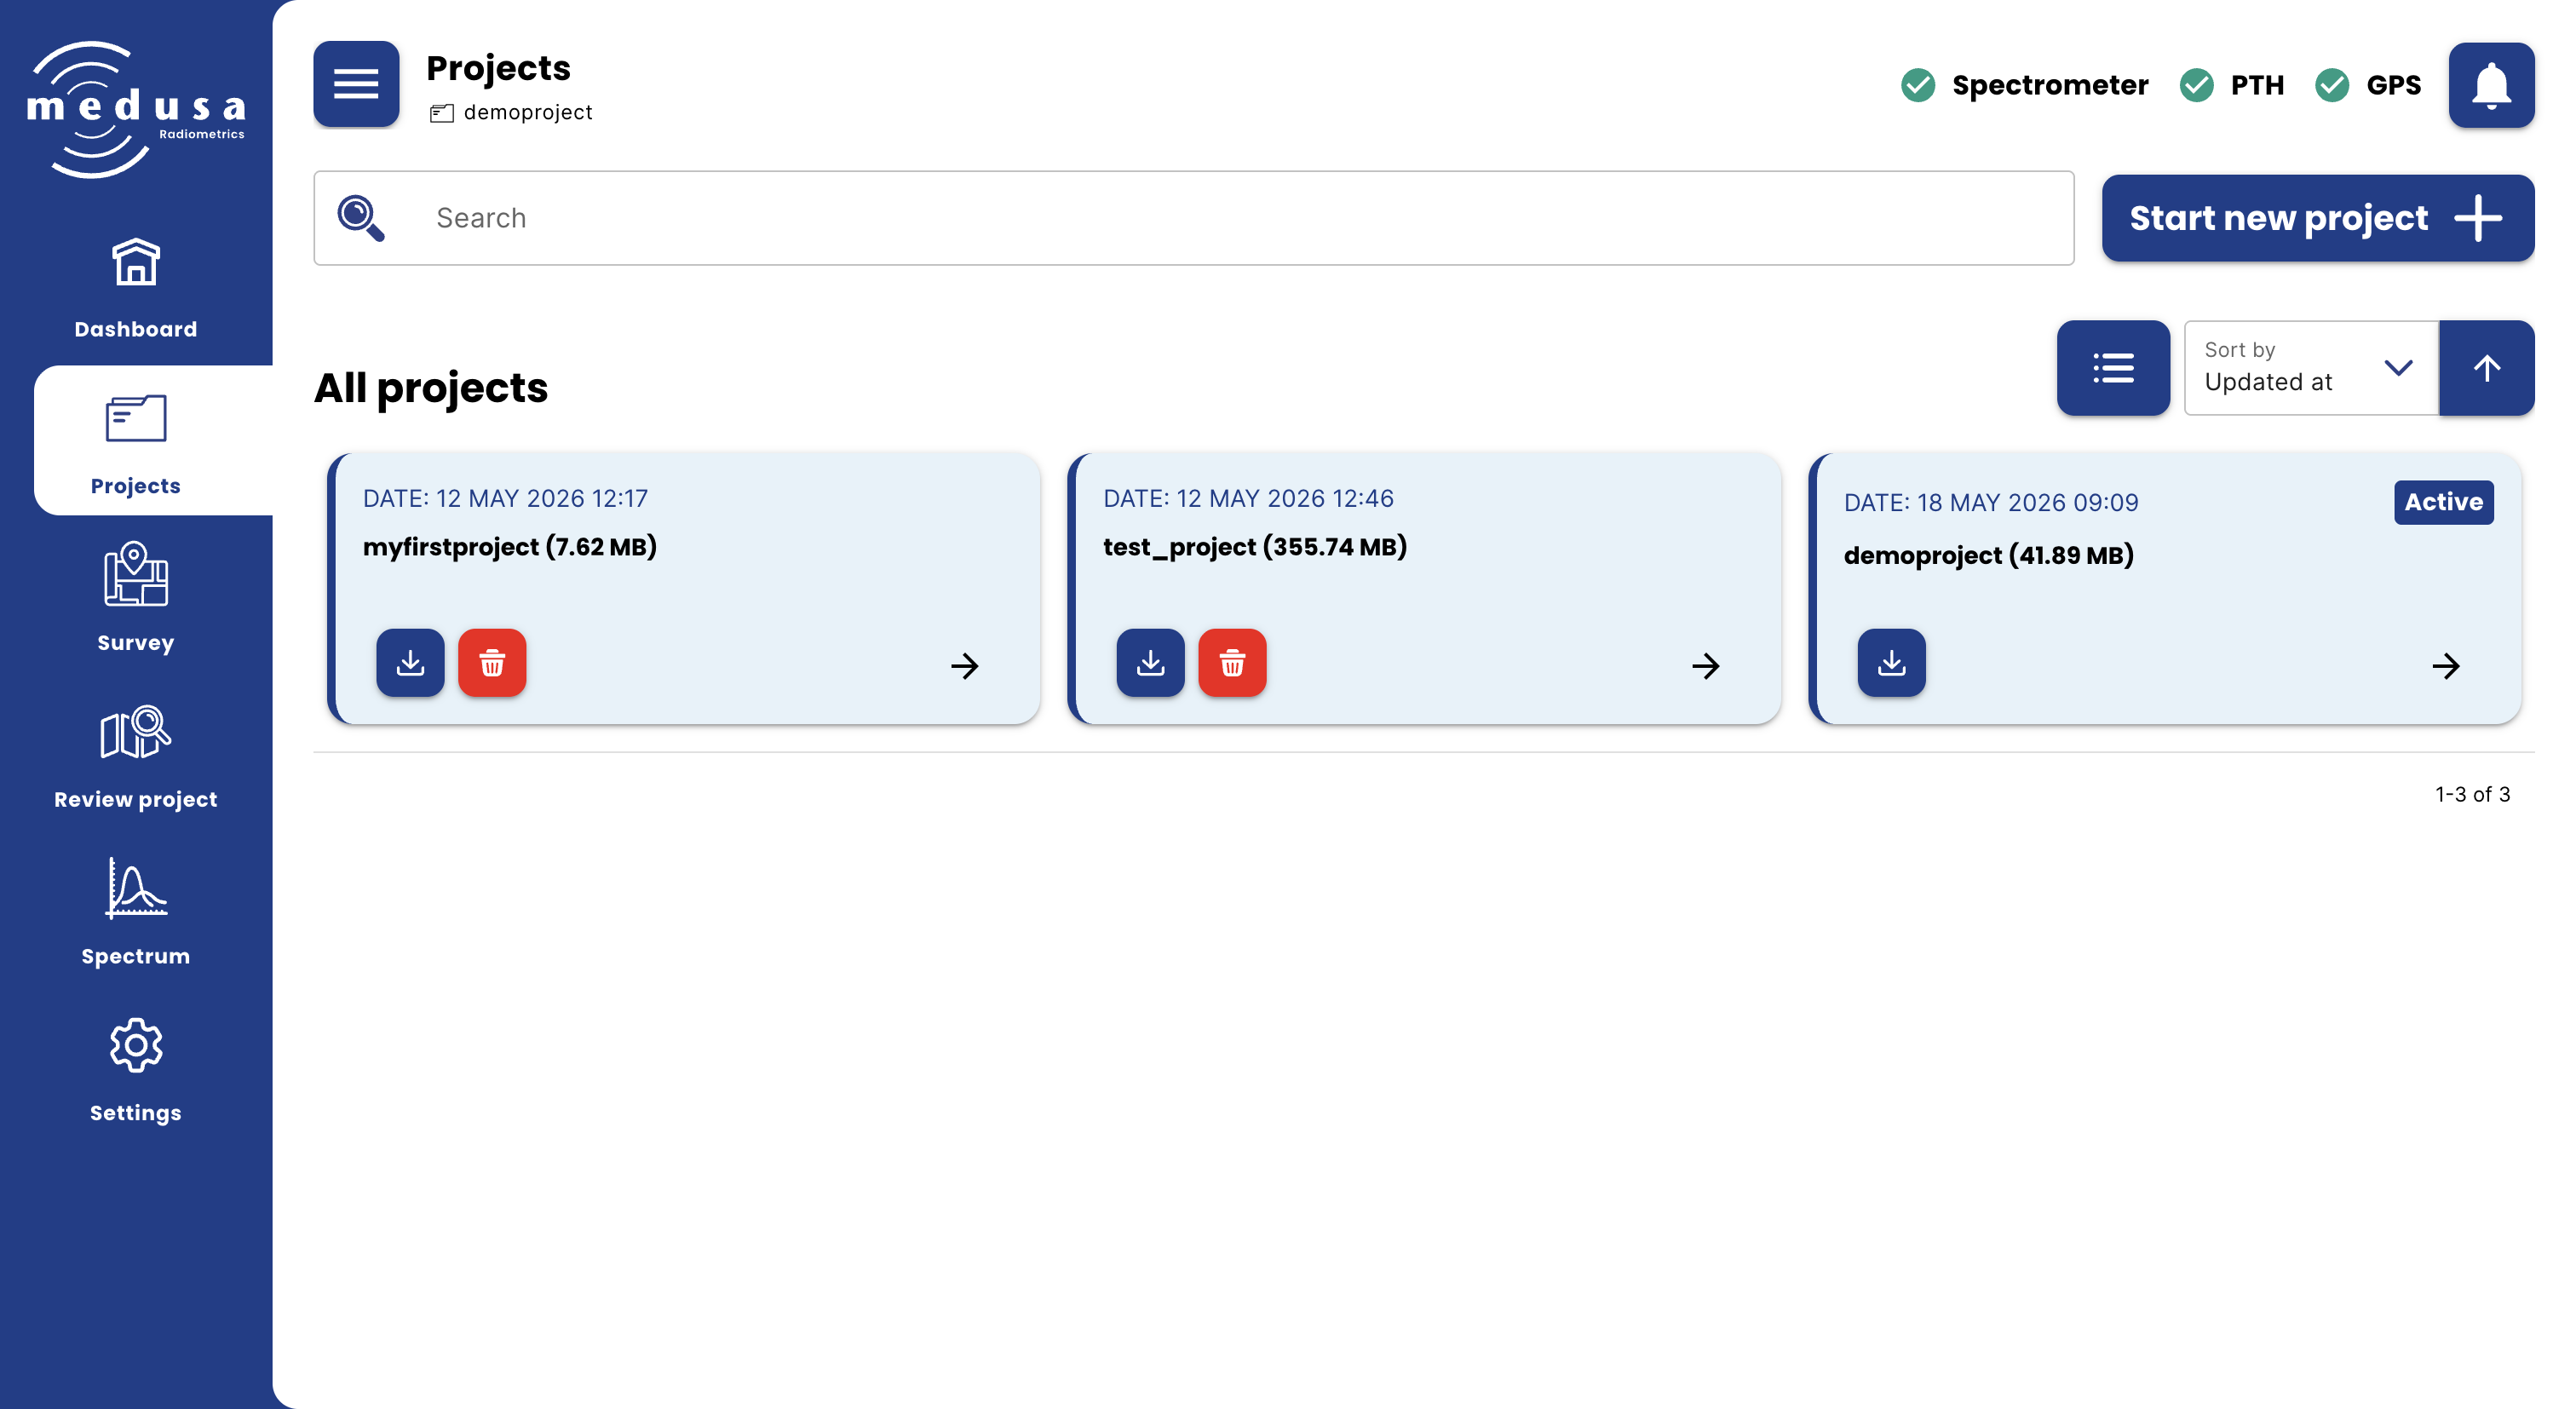
Projects page showing an existing list of projects with their names, sizes, and dates
To create a new project:
Click New project.
Enter a name — use underscores instead of spaces (e.g.
Survey_FieldA_20260703).Click confirm. The new project immediately becomes the active project and its name appears in the header bar.
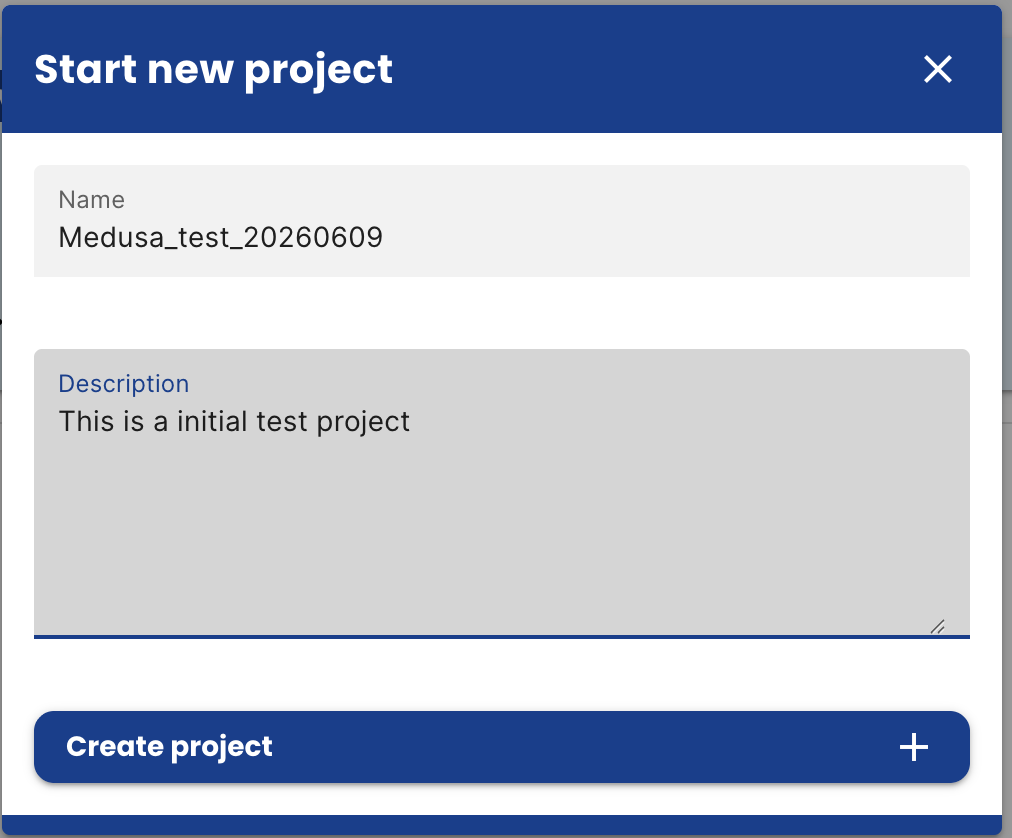
New project creation dialog with name field and create button
Once a project is created, all incoming data — spectra, GPS positions, PTH readings — is recorded automatically into it. There is no separate "start recording" button.
Step 7 — Verify the Measurement is Running
Before moving off to survey, do a final check:
Header: active project name is visible; spectrometer badge is green (stabilised).
Dashboard → Spectrometer line: count rate (cps) is updating every second and is in the expected range for the environment.
Dashboard → GPS line: GPS is active and a position fix is confirmed (green badge).
LEDs on the housing: PWR green, SCN blinking green, AUX green.
You can also open the Survey page to see the live map track updating as you move.
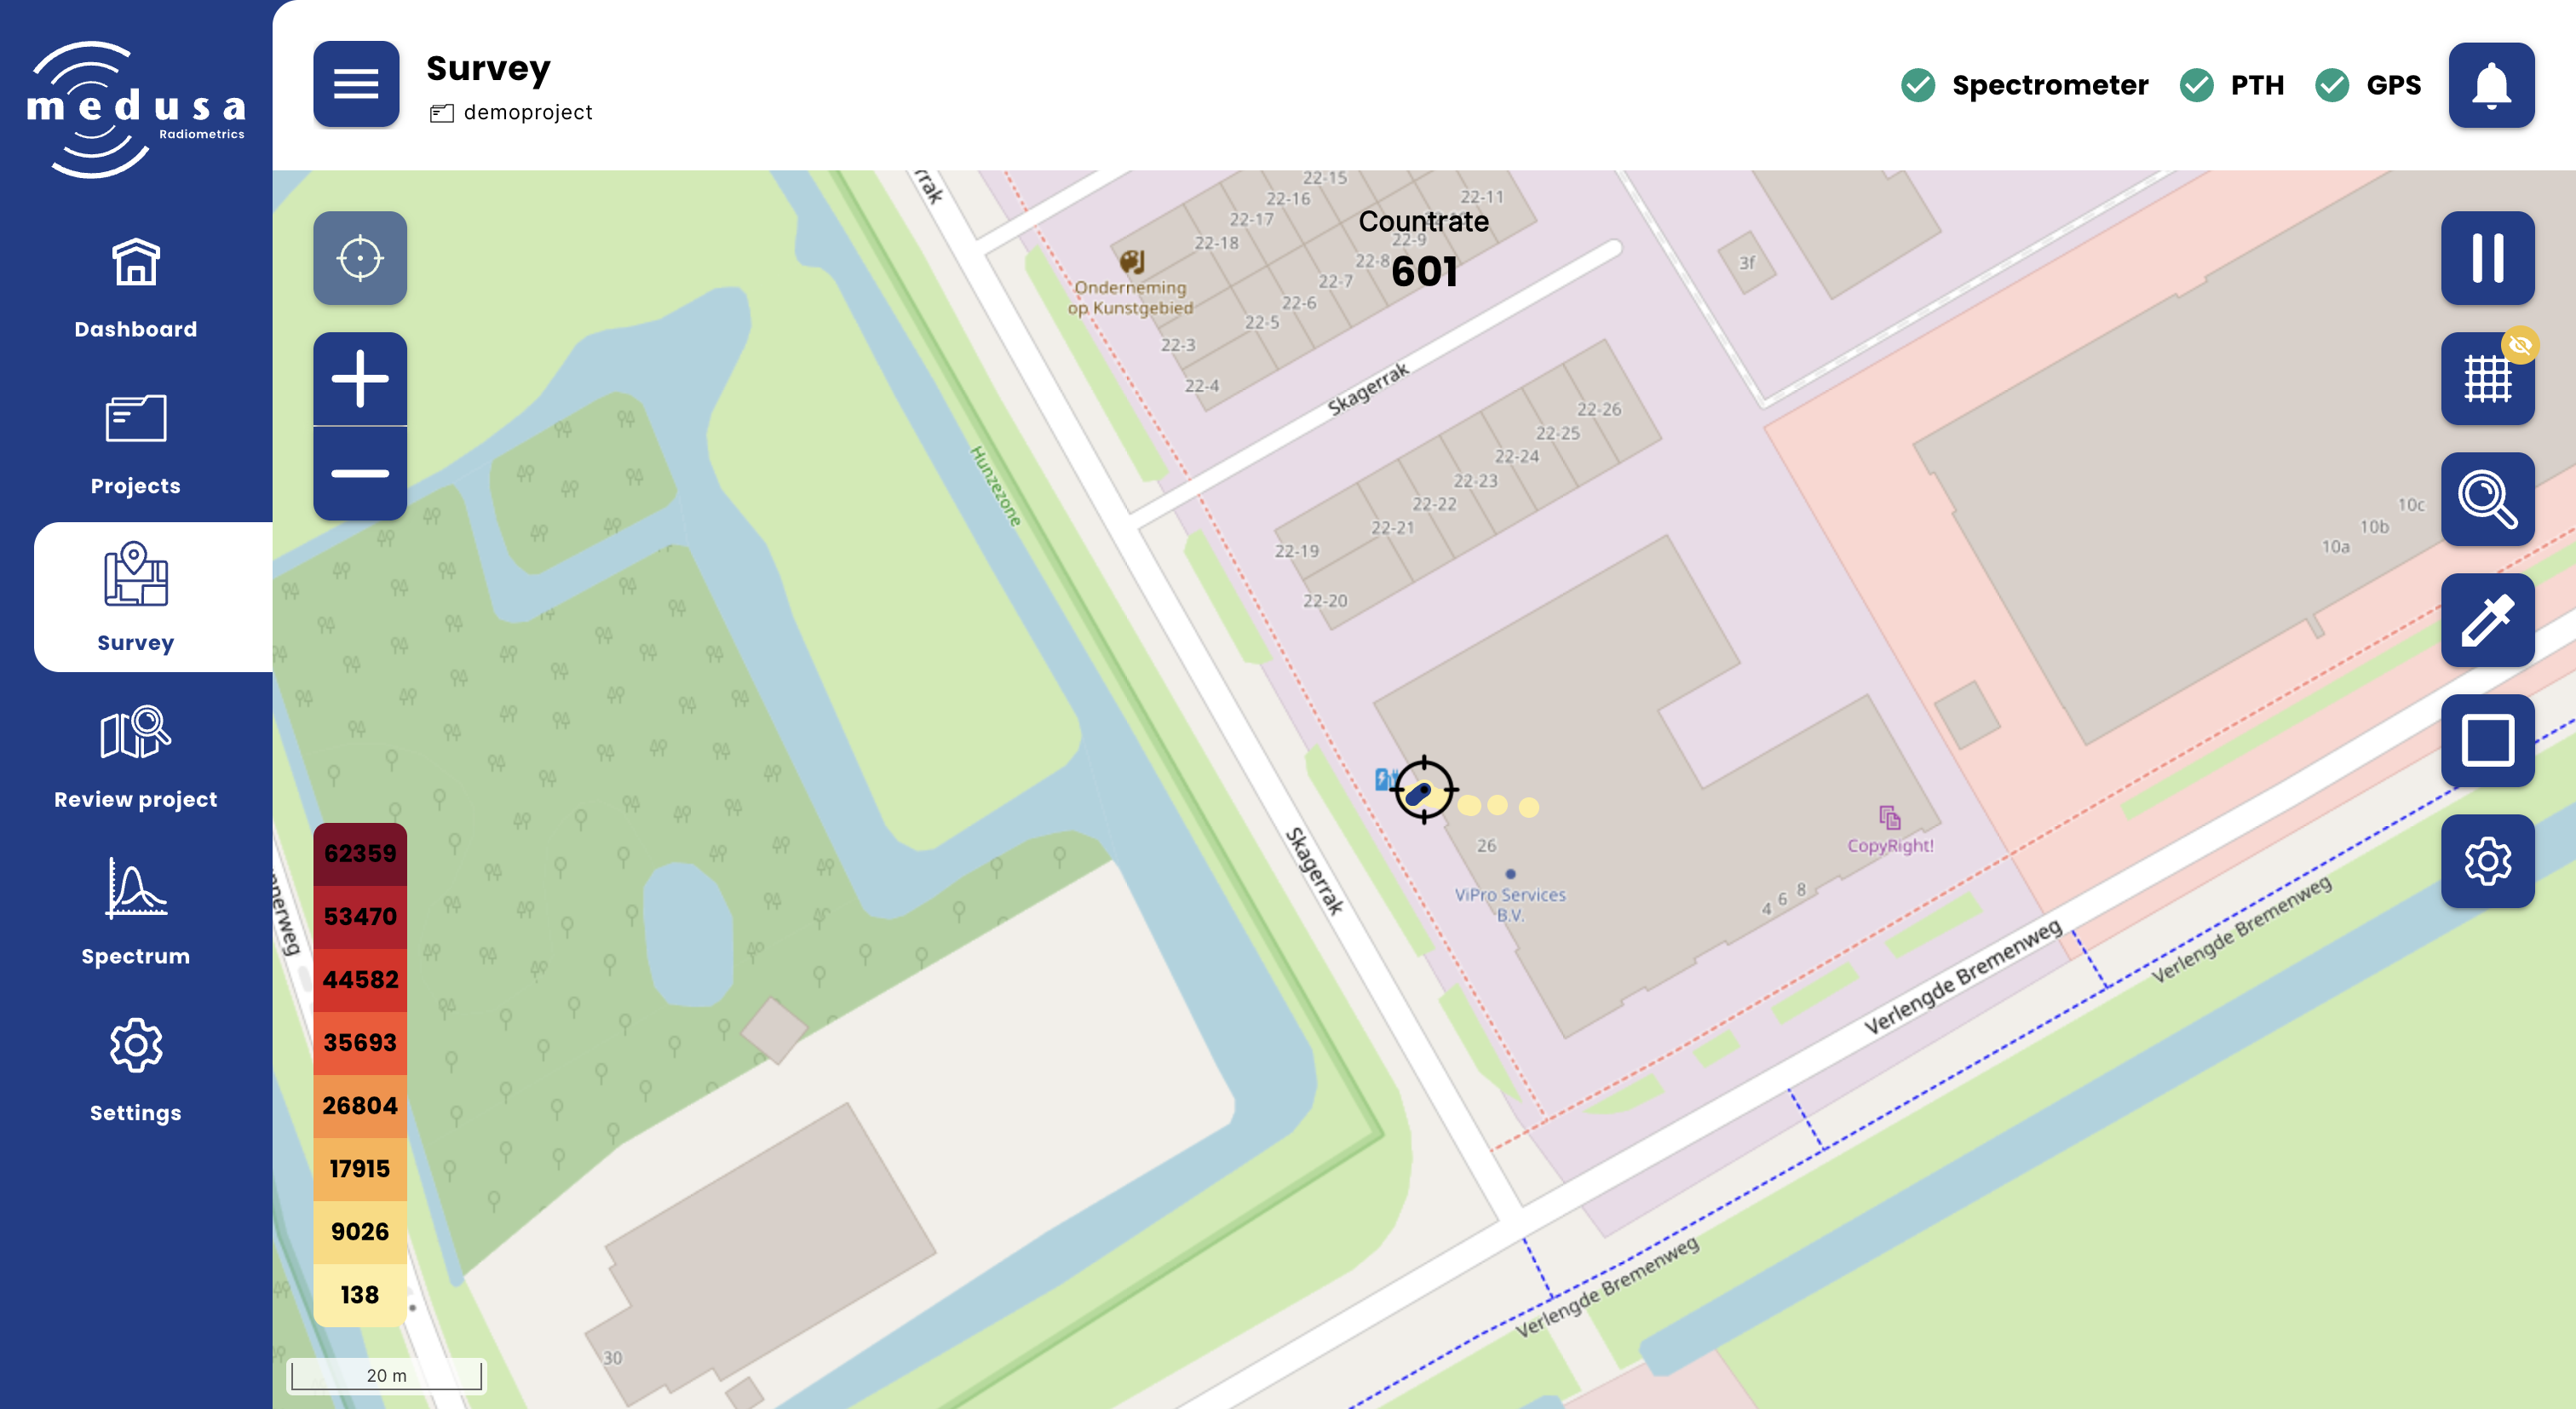
Survey page showing an active GPS track building in real time on the background map
The detector is now measuring. Begin your survey!
Detailed radionuclide concentrations and dose rate are inspected afterwards on the Review project page.
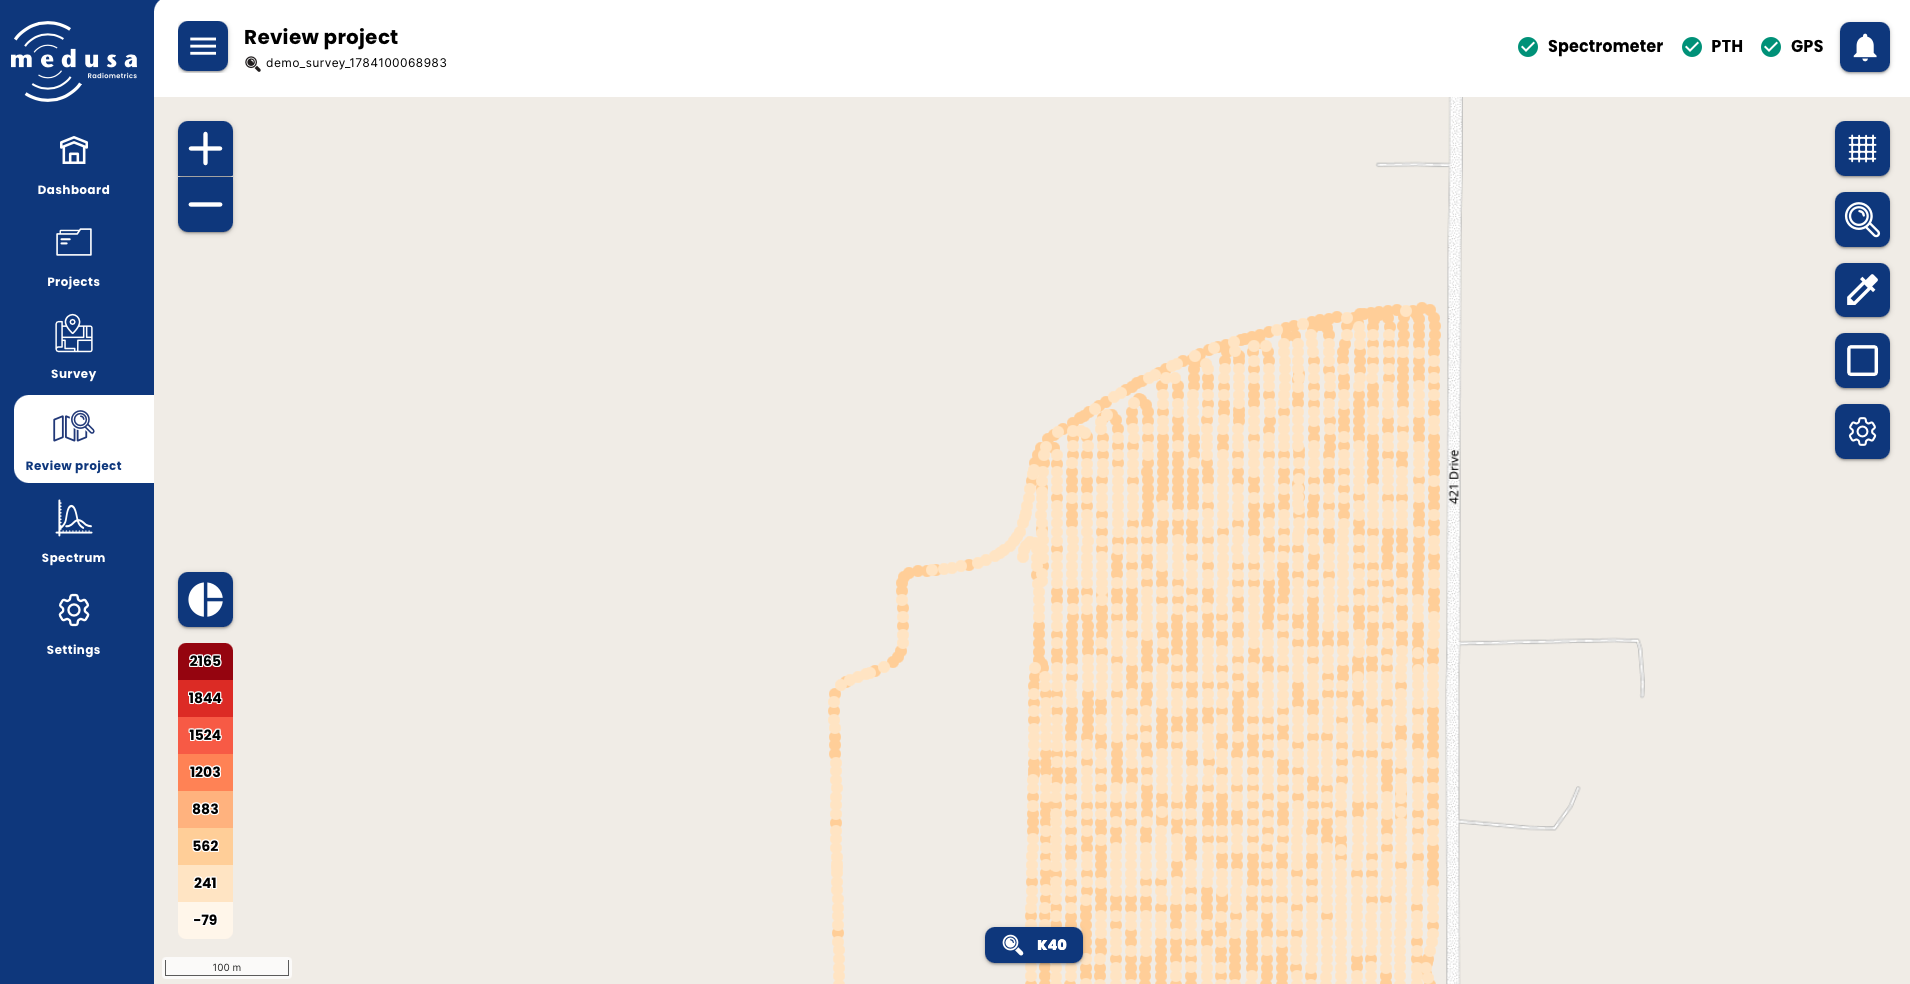
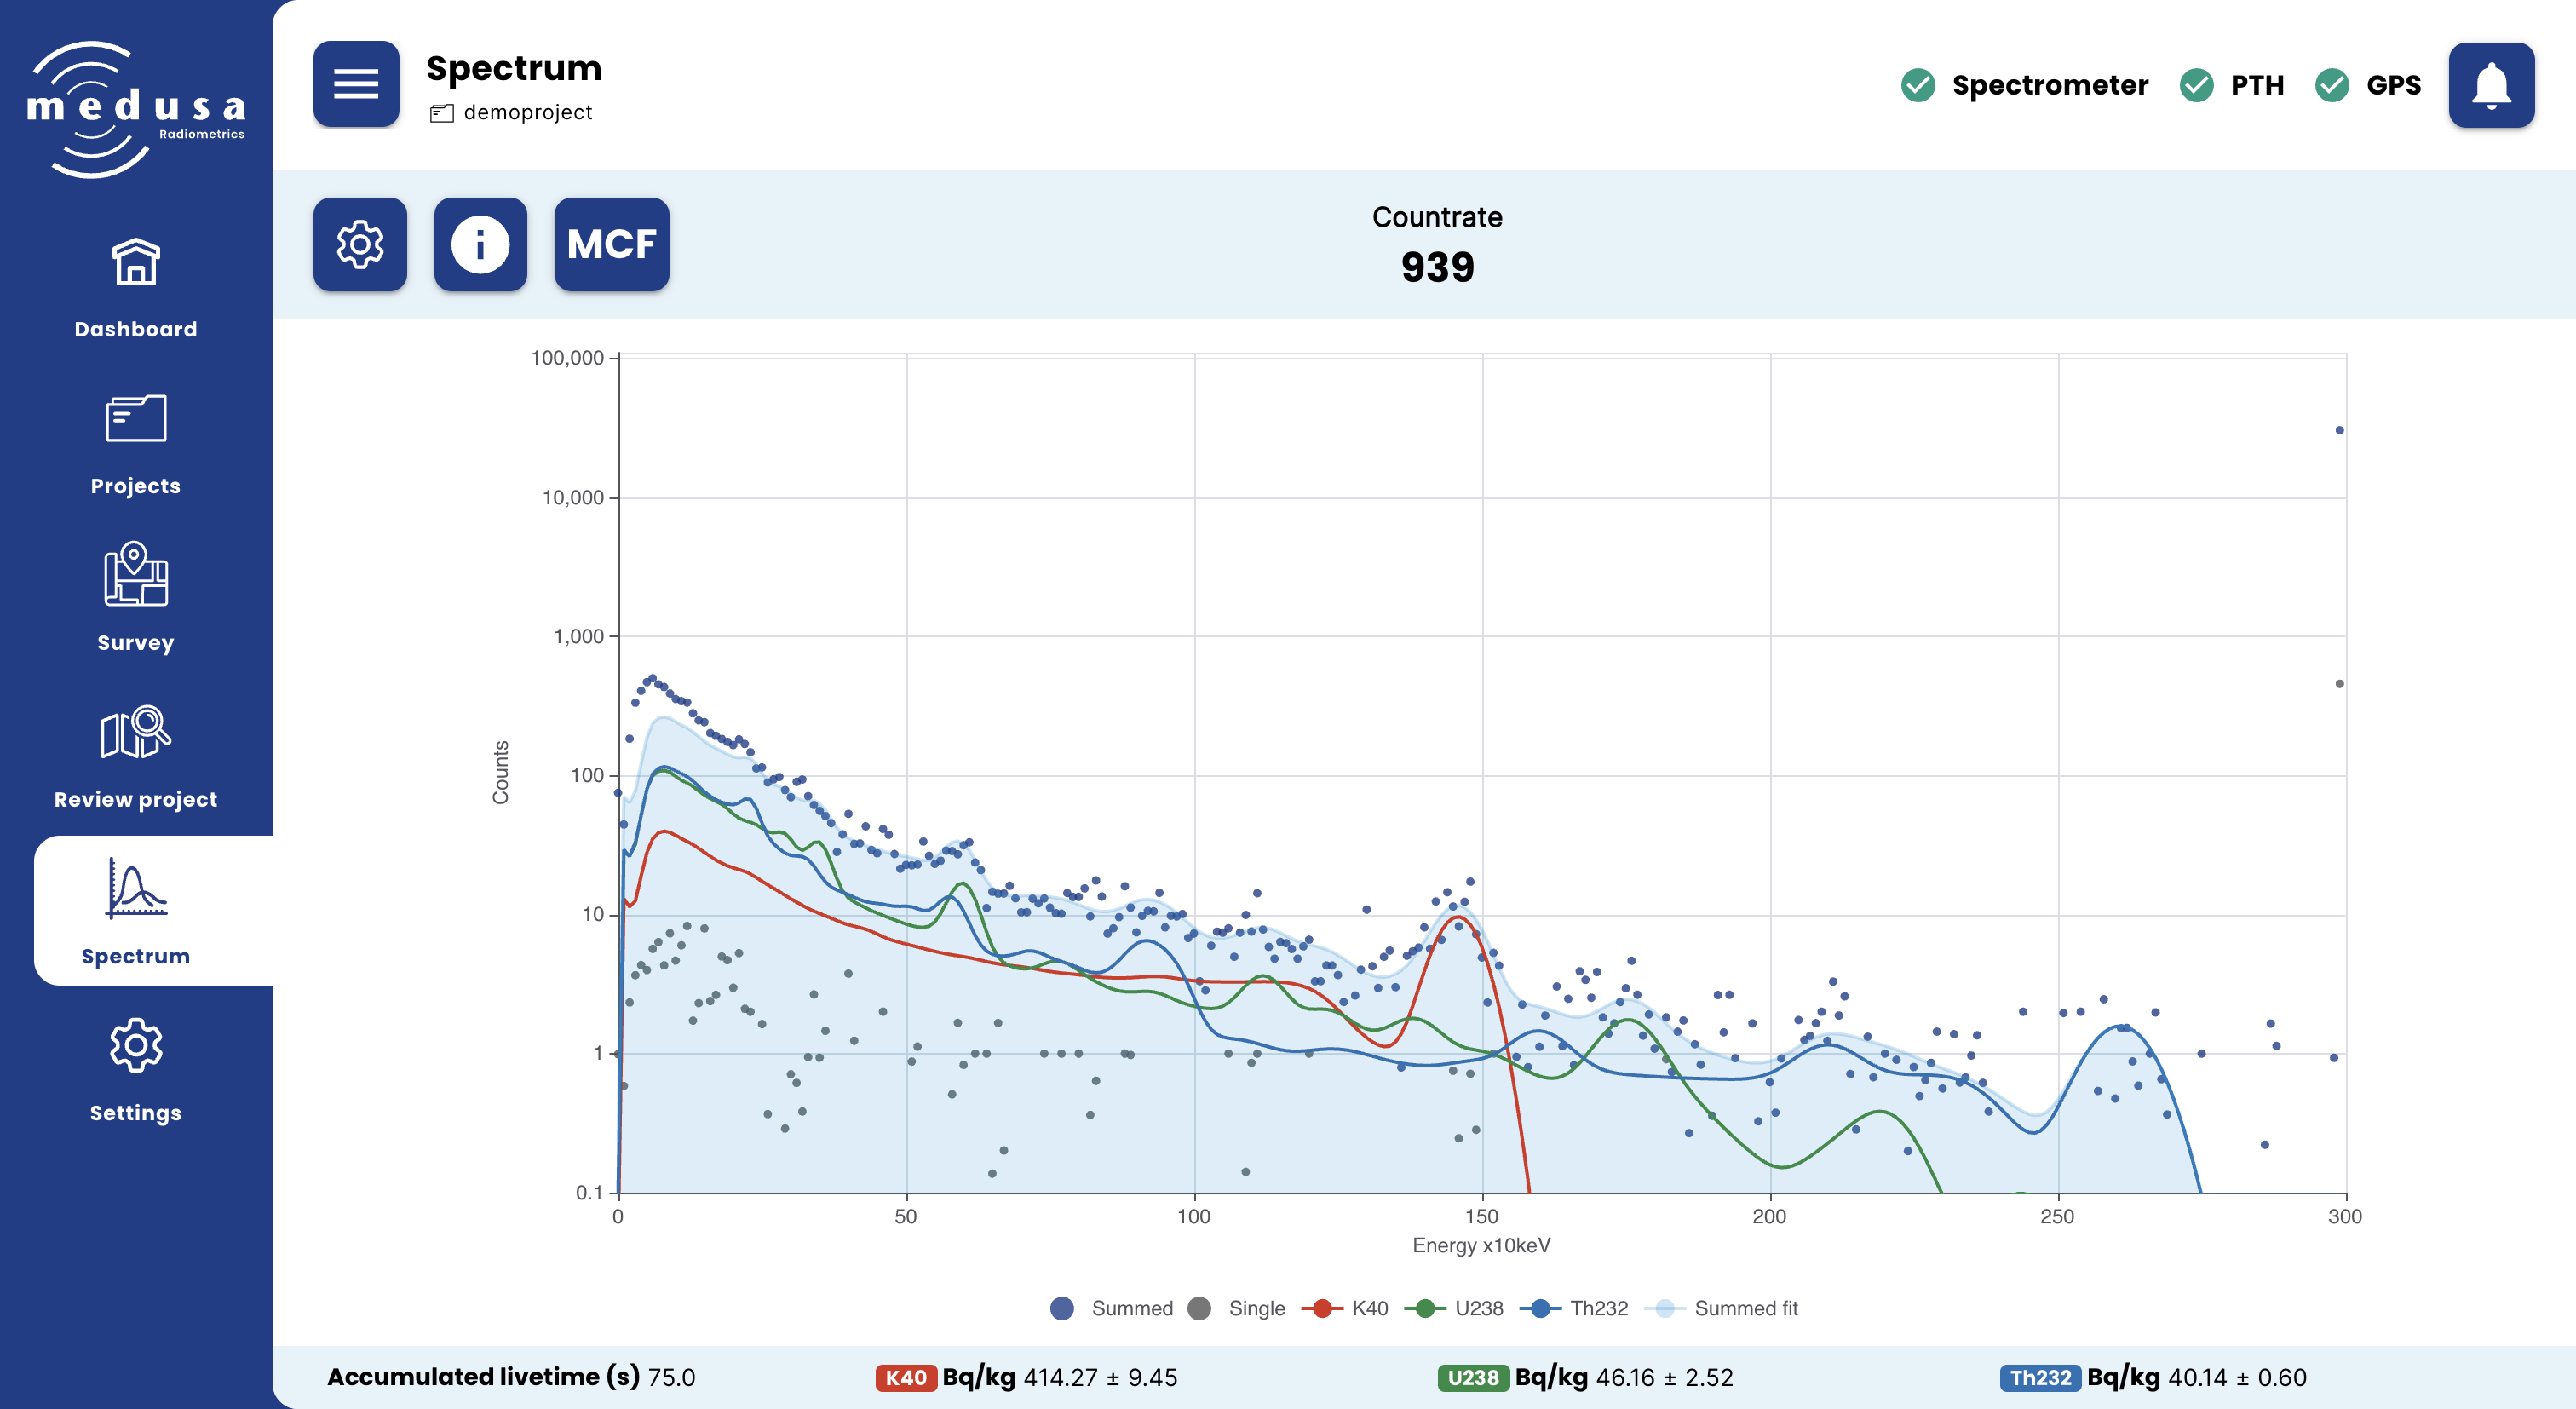
Both the raw and the stabilized spectrum can be shown in the plot from the Spectrum page. The raw spectrum represents the measured spectrum and is plotted on an x-axis that represents channels. The onboard microprocessor stabilizes (converts to an energy scale) and analyses (extracts radionuclide concentrations) this spectrum resulting in an energy spectrum and radionuclide concentrations.
Step 8 — Download Your Data
Data can be downloaded during or after the survey from the Projects page.
Navigate to Projects in the sidebar.
Click on the project name to open its detail view.
Click Download. The detector compresses the project to a
.zipfile — a progress bar shows compression status.When complete, a download prompt appears. Save the file to your computer.
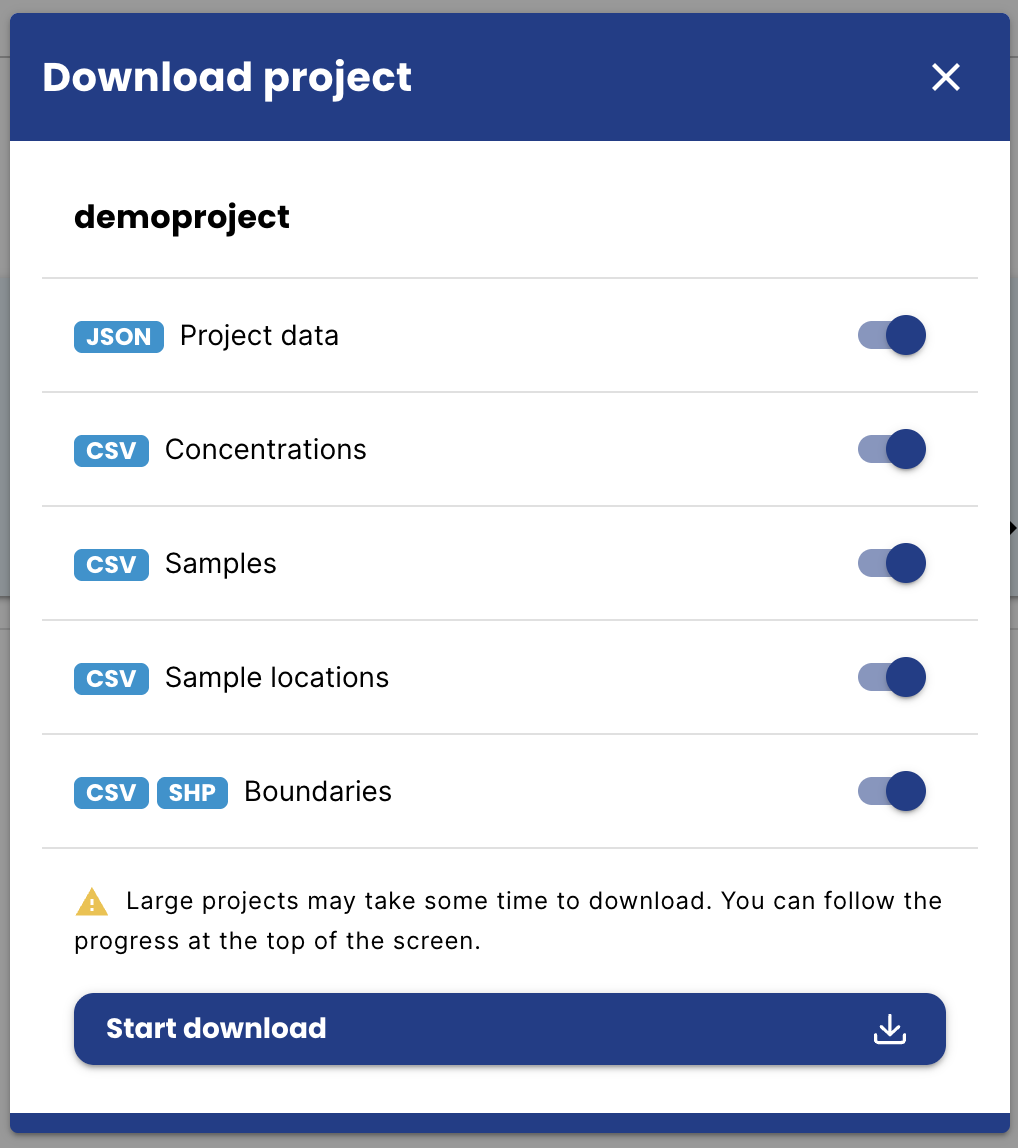
Project detail page showing the Download options
Mobile devices: If you download on a phone or tablet, remember to transfer the .zip file to a Windows computer where you can open it in GammAn for analysis.
Step 9 — Power Down
To power off the detector, simply disconnect the power cable or power bank. There is no shutdown sequence required — the detector writes data continuously and safely handles power removal.
Summary Checklist
# | Step | Check |
|---|---|---|
1 | Detector mounted securely | ☐ |
2 | Power cable connected; power source delivers ≥ 1.2 A | ☐ |
3 | PWR LED green | ☐ |
4 | Connected to mDOS via WiFi or Ethernet | ☐ |
5 | Spectrometer stabilisation complete (green badge) | ☐ |
6 | GPS fix confirmed (green badge) | ☐ |
7 | Active project created / confirmed | ☐ |
8 | SCN LED blinking green during measurement | ☐ |
9 | Data downloaded before powering down | ☐ |
Maintenance and repair
All Medusa detectors have a two year warranty and a one year support contract. Medusa can advise on working with the detector, inspecting data, and validating survey results.
The calibration file is valid for five years, after which the detector needs recalibration at the Stonehenge facility in Groningen.
For support, extensions, or calibration, contact:
For full documentation of all mDOS pages and settings, see the mDOS V4 Manual. For mounting specifications and connector pin-outs, see the Detector Technical Datasheet for your model.