
Appearance
Survey
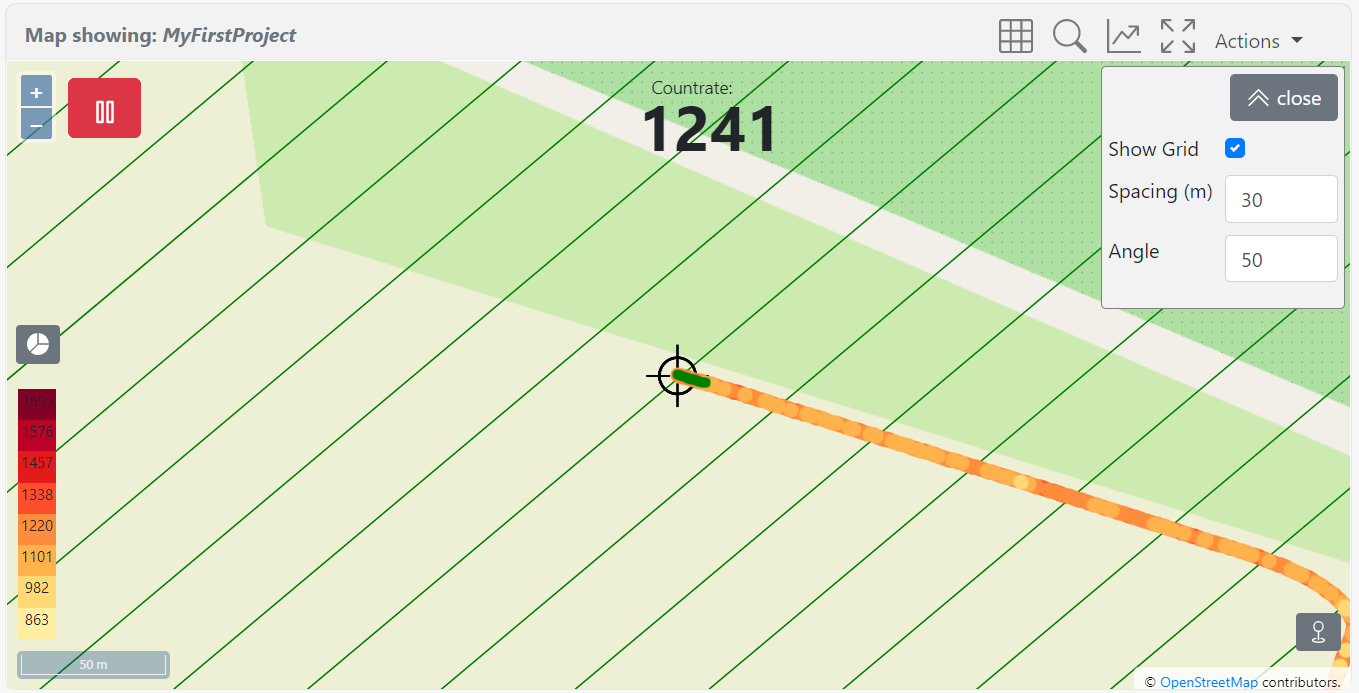
The survey page is filled with a map and several controls on and around the map. A screenshot of the survey page is shown below. The projects page also contains the map and has some extra functionalities.
Map controls
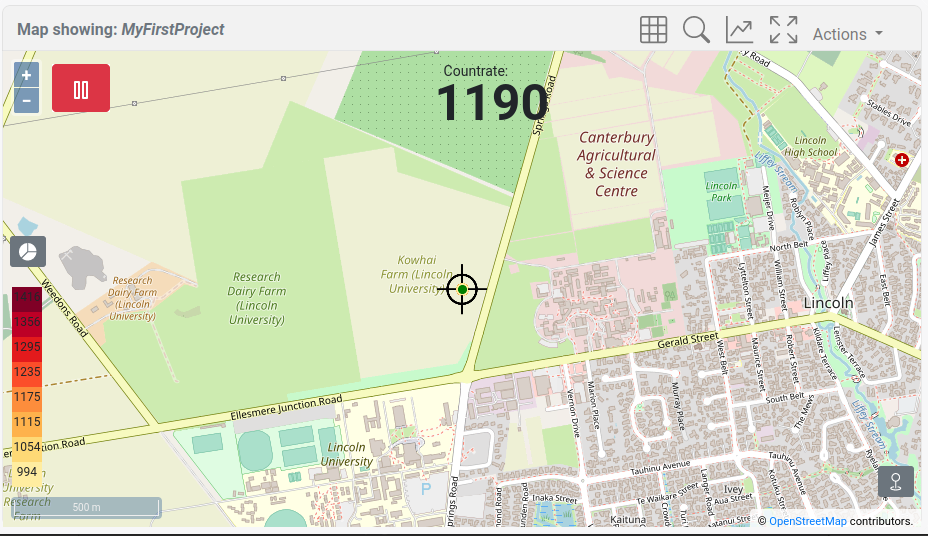
The table below lists the controls embedded on or around the map. It is indicated in italics if the functionality is only available on the projects page. Not all controls are directly visible, and the Actions menu in the top bar will give access to a number of the options described in the table below.
| Icon | Description |
|---|---|
| Map Showing: <project> | The project that is currently plotted on the map |
 | The z-value of the points plotted on the map. The z-value is plotted on a scale ranging from the minimum and maximum value present in the dataset Only shown on the projects page |
 | Reload the points in the current view |
 | Disable/enable follow GPS: will centre the map to each GPS position update This icon will turn green when enabled. |
 | Use offline maps: Show/hide the online/offline map |
 | Download background: this will download the map tile on the device so that no active internet connection is needed to render the background map |
 | Survey lines: Open the Survey lines panel See the detailed description below |
 | Find Sample locations: Open the find sample locations panel. See the sample page for more info on the use of this functionality. |
 | Measure sample(s): Open the measure sample locations panel. See the sample page for more info on the use of this functionality. |
 | Map settings: Open the map setting panel to change the units used on the map, or the size of the plotted points |
 | Switch to fullscreen mode |
 | Change the plot limits of the points on the map. Pressing the button will rotate through the options: 1, 2, 3 x standard deviation and min-max values. |
 | Pause the meausurement. Note that the detector will continue collecting data. However, data points are not plotted in the web viewer, and these data points have been marked as 'paused' points. As a result, data collected when the device was in paused mode can be retrieved from the project. |
 | Centre the map on the last known GPS location |
Survey Lines
Enable/disable survey lines that can be used as reference points when doing a survey. The line spacing and angle of the survey lines can be specified in meters or feet, depending on the unit settings.
The survey line settings are stored on the detector and will remain active across reboots of the detector.
Info
Zoomlevel
If the grid is not visible, try zooming in.