
Calibration procedure
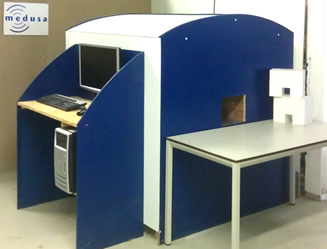
Spectrometers will be calibrated using the Stonehenge calibration setup. Stonehenge is a brick castle (outer dimensions: 120x120x120 cm3) with a horizontal square (20x20 cm2) opening at the front in which a detector under test may be entered. The opening can be closed on the front and the end by 15 cm thick blocks, leaving only a 6x6 cm2 square opening in the front.
 |
|---|
The Stonehenge calibration setup |
The radionuclide concentrations of the bricks were measured using gamma ray spectrometry and are presented in the table below.
Radionuclide | Concentration (Bq/kg) | Concentration (ppm or %) | Concentration as oxides (ppm or %) |
|---|---|---|---|
232Th | 52 | 13 ppm Th | 14.64 ppm ThO2 |
238U | 41 | 3.33 ppm U | 3.94 ppm U3O8 |
40K | 535 | 1.69% K | 2.08% K2O |
The Stonehenge calibration facility has been modeled using a Monte Carlo Simulation code (MCNPX). In the simulations, the bricks were assumed to be pure SiO2 with a density of 2.32 kg dm-3. Air was taken as a mixture of N2 (79 % mass) and O2 (21% mass) with a density of 1.293 kg m-3.
Monte Carlo Models
Using the Monte Carlo code, a model is created for the crystal present in the spectrometer to be calibrated. The model also includes most other components which may have an influence on the spectrum being collected.
For the model, response curves are simulated assuming 1 Bq/kg sources of 40K, 137Cs, 238U and 232Th in the Stonehenge geometry. Such a response curve is called a pure spectrum or standard spectrum and represents the spectrum one would measure in the hypothetical situation of a tool inside a Stonehenge-type geometry having an activity of 1 Bq/kg.
Calibration procedure
The next step in the calibration of a spectrometer is to measure a gamma spectrum inside the Stonehenge setup. The spectrum measured is subsequently energy stabilized, normalized and approximated by the Monte Carlo calculated, unbroadened histograms. In this approximation procedure, the following steps are applied:
Determination of the spectral resolution of the tool; the unbroadened response histograms are energy-broadened to fit the spectral resolution of the detector;
Determination of a general scaling factor describing the difference between a theoretical tool response (response without losses) and the actual response;
Determination of a function mapping the “raw” multichannel spectral data to an energy-calibrated spectrum. This procedure basically determines the function needed to map a channel in the MCA spectrum to energy in the energy spectrum. In most cases a quadratic mapping function is used, described by three parameters a0, a1 and a2. These a-factors are the coefficients of the 2nd order function translating the channel numbers into energy. In an ideal multi-channel system, the factors a0 and a2 would be zero and a1 varies solely with the temperature of the system (c.f. Hendriks et al, 2001);
a0 represents the channel offset present in the multichannel system
a1 represents the (temperature dependent) linear scaling factor;
a2 represents an alinear correction to the channel-energy scaling
Converting the calibration geometry into the geometry for the application in which the tool is going to be used. In this case, the tool will be used in an carborne application which implies a “semi-2pi” geometry.
These steps are described in detail in Van der Graaf et al, 2008. The result of the calibration procedure is a set of standard spectra that can be used in Full Spectrum Analysis to analyze gamma-ray data measured in the field. The output of the calibration procedure is a Medusa Calibration File (MCF) that can be used in the Medusa spectral analysis software.
An example of a calibration report: Calibration report - MS-1000.9999.pdf
Recalibration
We recommend having the calibration checked every 5 years.
We offer a few options for recalibration:
Calibration Check: The client submits measurement data recorded at their local workshop or in the field, no radioactive sources are required, as the data should contain a background spectrum only. Depending on detector size, a one-hour measurement is sufficient. Based on the recorded data, we will verify whether the existing calibration is still valid. The calibration check includes a validation report and a formal recommendation on whether recalibration is needed.
Remote Recalibration: If sending the spectrometer is not practical, we can perform a recalibration remotely, based on a background spectrum recorded on-site. With the background spectrum, we can determine calibration parameters such as the offset, alinearity correction and resolution (peak width) of the spectrometer. The only parameter that cannot be determined is the efficiency (overall scaling factor), as this requires the spectrometer to record data in a well-known environment such as our calibration set-up. For a remote calibration, we use the efficiency from the original calibration instead.
Full Recalibration: A full recalibration is carried out at our calibration set-up, which requires the spectrometer to be sent to our office.
References
Hendriks, P.H.G.M., Limburg, J. and de Meijer, R.J. 2001. Full-spectrum analysis of natural [gamma]-ray spectra. Journal of Environmental Radioactivity, 53: 365-380.
Van der Graaf, E., J. Limburg, R.L. Koomans and M. Tijs. 2011.Monte Carlo based calibration of scintillation detectors for laboratory and in situ gamma ray measurements. Journal of Environmental Radioactivity, 102: 270-282.
{}