

Appearance
1. User interface
In this chapter all commands accessible through the user interface will be discussed. The user interface contains the following elements:
· Menu bar;
· Spectral view;
· Plot view;
· Data view.
An image showing the layout and names of these elements can be found in the topic User interface.
Menu bar
The menu bar contains a shortcut to the most important options of Gamman.
Menu bar

| Command | Description |
|---|---|
| Create from mDOS json | Create a GSF file from json files obtained in mDOS |
| Create from MDL | Create a GSF file from MDL files |
| Open Project | Open an existing GSF file |
| Toggle view | Switch between plot view and spectral view |
| Selection | Process only the selected raw (untagged) data using a specified fitting scheme |
| Process all | Process all of the raw (untagged) data using a specified fitting scheme |
| Plot | Plot a graph with the specified settings in the plot view |
| Plot settings | Open the plot settings dialog to alter the appearance of the chart in the plot view or spectral view or to print one of the views |
| View log | Opens the project log viewer |
Spectral view
The Spectral view consists of a graph containing spectral information about the current selected data points and a menu bar on the left containing information and settings. This chapter will describe these various elements.
Spectral view
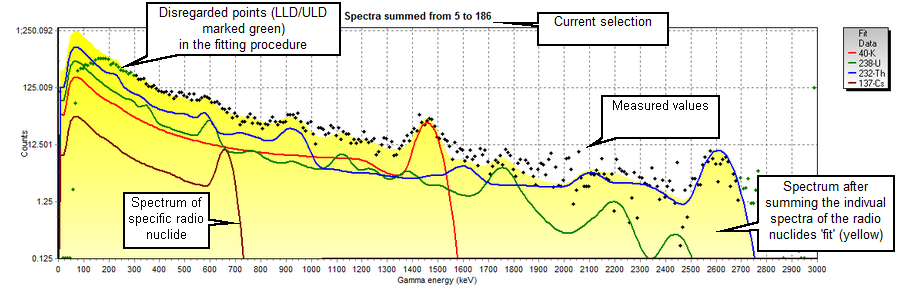
Vertical logarithmic scale (Y-axis) represents the total number of gamma particles counted by the sensor. Horizontal linear scale (X-axis) represents the gamma energy. The gamma energy keV (kilo electron volt) is the unity of energy of a particle.
Left menu bar
[missing image: fitresults table.png] 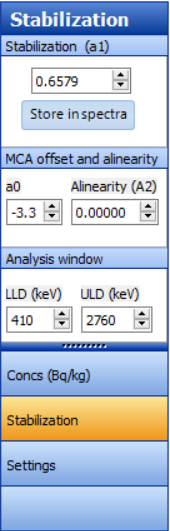
Fitresults
Contains no commands but information about the fit of the current selection (concentration of radio nuclides and stabilization factors):
· Concentration of the radio nuclides in [Bq/kg] or [ppm] and countrate [particles/s];
· Standard deviation (indicated with letter 'S') of the radio nuclides and countrate [Bq/kg] or [particles/s] ;
· Chi² and Stabilization (A1) values containing information about the quality of the fit and stabilization.
More information can be found in the topic Stabilization.
Stabilization
| Command | Description |
|---|---|
| Linear stabilization (A1) | Linear widening of the spectrum caused by difference in temperature. Only applies to selected spectra and can be stored after changing. |
| Offset (A0) | Horizontal offset of the spectrum. |
| Alinearity (A2) | Squared widening of the spectrum, correcting for the possible alinearity in the measurement. |
| LLD | Lower level discriminator [keV]. LLD data is used for stabilization, but not used in the fitting procedure. |
| ULD | Upper lever discriminator [keV]. ULD data is used for stabilization, but not used in the fitting procedure. |
Settings
| Command | Description |
|---|---|
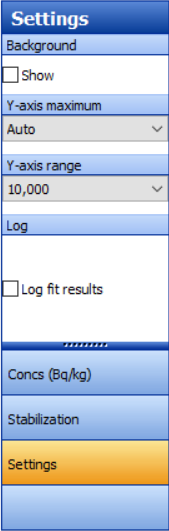
| Show background | Make backround spectrum visible or invisible in the spectral view |
| Y-axis maximum | Set the maximum value of the Y-axis (total counts) to a certain value. Values from 10 to 1000.000 can be chosen as well as an automatic mode. |
| Y-axis range | Set the ratio between the maximum and minimum value on the Y-axis to a certain value Values from 100 to 100.000 can be chosen. |
| Log fit results | - |
Plot view
The plot view consist of a graph where the various data fields inside the data set can be plotted against each other. The plot can be modified using the left menu bar.
Plot view
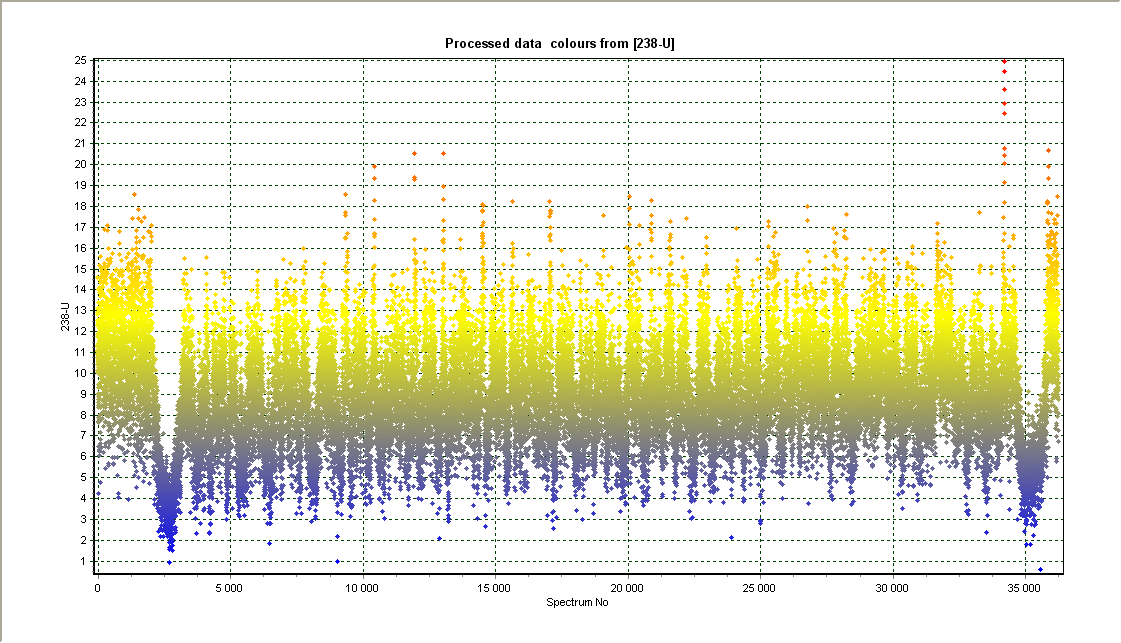
The source of the axis can be changed in the left menu bar.
Left menu bar
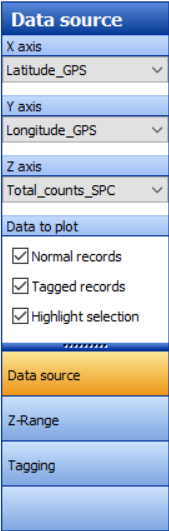
Data source
| Command | Description |
|---|---|
| X-axis | Change the source data of the horizontal axis |
| Y-axis | Change the source data of the vertical axis |
| Z-axis | Change the source data of the Z-axis, displayed as a color |
| Normal records | Set normal records to be visible or invisible in the plot view |
| Tagged records | Set Tagged records to be visible or invisible in the plot view |
| Highlight selection | Set selected records in the data table to be visible or invisible in the plot view |
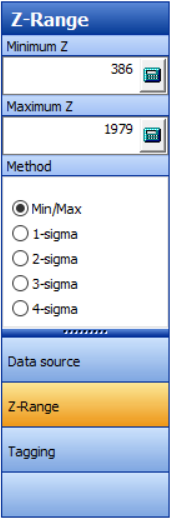
Z-Range
| Command | Description |
|---|---|
| Minimum Z | Defines the lower limit of the color scale (blue) |
| Maximum Z | Defines the upper limit of the color scale (red) |
| Method | |
| Min/Max | Use the lowest/highest value from the data set for the minimum/maximum z |
| x-sigma | Use x times the value of the standard deviation for the minimum and maximum z x can be 1 to 4 |
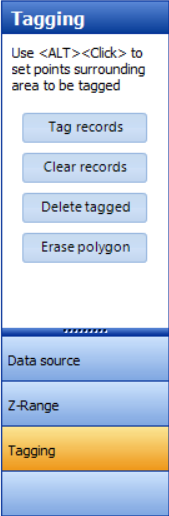
Tagging
| Command | Description |
|---|---|
| Tag records | Tag all records enclosed by the polygon in the plot view |
| Clear records | Undo tags of selected records enclosed by the polygon |
| Delete tagged | Delete all tagged records |
| Erase polygon | Clear the current polygon |
Data view
The data viewer displays the data imported numerically. From the data viewer, tags and selections can be made. The menu is available by right clicking on the table. Double clicking a data column while in the view log will show statistics (minimum, maximum, average, standard deviation).
Data viewer
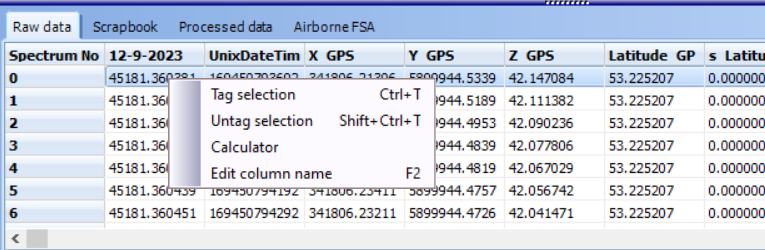
| Command | Description |
|---|---|
| Raw data | Data tab with only the raw data. This tab cannot be deleted. |
| Scrapbook | Data processed by "Process selection" and "Average and fit selection" will appear here. This tab cannot be deleted. |
| Processed data | Data tab containing data which is processed by using "Process all". This tab can have any name given after processing. |
| Airborne FSA | Data tab containing data which is processed by FSA airborne corrections. This tab can have any name given after processing. |
| Tag selection | Tag selected items from the data viewer table. |
| Untag selection | Undo the tagging of the seleted tagged items. |
| Calculator | Opens the calculater used to modify or replace data. |
| Edit column name | Edit the name of the right-clicked column. |