

Appearance
2. Menus and dialogs
In this chapter all commands will be described accessible through the File menu and the dialogs Process, Plot settings, Program settings, and About.
File menu
From the File menu all basic commands can be accessed. Listed below is a summary of all commands available through the File menu. For a more detailed description on each command, please refer to the Tutorials.
| Item | Command | Shortcut | Description |
|---|---|---|---|
| File | Open | Open an existing GSF file | |
| Create from | Ctrl + N (most recent used) | Create a new project from an existing JSON, CSV, MDL, GRE, SDF, GRS or LOG dataset | |
| Save | Ctrl + S | Save current GSF file | |
| Save as... | Save current GSF file with a different file name or path | ||
| Import aux data... | Enables the use of auxiliary data | ||
| Export with template | Export the data as a csv file | ||
| Export Spectrum | Export the stabilized or non-stabilized spectrum as an ASCII file | ||
| Close project | Closes the current GSF project | ||
| Exit | Alt + F4 | Quit Gamman | |
| Edit | Copy selection | Ctrl+C | Copy selected data records from the data view table to the clipboard |
| Copy chart | Copy the graph from the current view ( data or plot view ) to the clipboard | ||
| Tag selection | Ctrl+T | Tag selected data records | |
| Untag selection | Shift+Ctrl+T | Untag selected data records | |
| Invert tagged | Tag all the current untagged records and untag all the current tagged records | ||
| Untag all | Untag all tagged records from the currently active table | ||
| Delete tagged | Delete all tagged records from the currently active table | ||
| Delete selection | Delete selected records | ||
| Append column | Under construction. To add synched auxiliary data, see "Import aux data". | ||
| Delete column | Delete the column selected in a data table | ||
| Calculator | Open the calculator to modify selected data | ||
| Insert time lag | Opens the time lag dialog to modify selected data | ||
| Spectral processing | Process all | Process all (untagged) records from the raw data table using the specified fitting scheme | |
| Process selection | Process only the (untagged) selected records from the raw data table using the specified fitting scheme | ||
| Average and fit selection | Ctrl+F | Summarize the spectra from all the (untagged) selected data records into one value and calculate the radionuclide concentration | |
| Full-spectrum elevation correction | Process all (untagged) records from the raw data table using full-spectrum elevation correction | ||
| Radon finder | Scan the spectra from all (untagged) data records for possible influence from radon particles in the air using the Radon finder | ||
| Cosmic spectrum builder | Find a cosmic and carrier background spectrum from the selected data using the cosmic spectrum builder | ||
| Tools | Coordinate conversion | Converts latitude-longitude coordinates to UTM (WGS84) or Dutch (RD) coordinates | |
| Borehole corrections | Can transfer measured borehole data to reference borehole data | ||
| Dose rate calculation H*(10) | Calculates the H*(10) doserate for every record based on the collected spectrum | ||
| Classic elevation correction | Process all (untagged) records from the raw data table using classic (windows) elevation correction | ||
| Classic cosmic background finder | Find a cosmic and carrier background spectrum from the selected data using the classic cosmic spectrum finder | ||
| Scripter | Enables scripting of standard processes in Gamman | ||
| Calibration | Edit active calibration data | Enables altering the calibration file currently used for the project | |
| Edit calibration file | Enables altering a selected calibration file | ||
| Replace calibration data | Replace the current calibration file with another | ||
| Re-run energy calibration | Recalculates the stabilization factor a1 for the project | ||
| Background editor | Enables for different background corrections | ||
| Help | About | Open the about dialog | |
| Check for updates | Check the Medusa site for new versions of Gamman | ||
| Program settings | Open the program settings dialog |
Process dialog
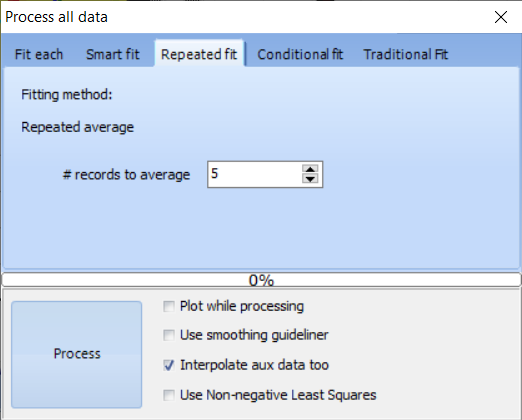
The process dialog is used to specify the desired fitting scheme and settings. Five fitting schemes are present in Gamman:
- Fit each
- Smart fit
- Repeated average
- Conditional summing.
- Traditional fit
| Command | Description | |
|---|---|---|
| Fit each | Each spectrum in the raw dataset is fitted with the standard spectrum | |
| Smart fit | Calculates the running average over a number of data points taking into account the spatial correlation the points have with each other | |
| Smoothing factor | Define the number of data points used in the running average | |
| Repeated average | Averages a number of data points | |
| # records to integrate | Defines the number of data points to average and combine | |
| Conditional fit | Average a number of records until a specified uncertainty is reached | |
| K-40 | Radionuclide 40-K (in %) | |
| U-238 | Radionuclide 238-U (in %) | |
| Th-232 | Radionuclide 232-Th (in %) | |
| Cs-137 | Radionuclide 137-Cs (in %) | |
| Traditional fit | Uses the 'classic' windows method to derive nuclide concentrations. Here, the energy window can be specified for each element as wel as the number of records to average. Stripping factors for the selected windows can be obtained by clicking 'Get Strippings'. | |
| Process | Process specified records using current fitting scheme and settings | |
| Plot while processing | Plots spectra during processing. Checking this box will slow down processing. | |
| Use smoothing guideliner | Allows to select a column to use as guideliner* | |
| Interpolate aux data too | While averaging a number of records, the other data columns will be interpolated to represent a correct value for the averaged data | |
| Use non-negative least squares | Use the non-negative least squares method when processing to avoid possible negative concentration values |
*Checking use smoothing guideliner displays a dropdown box that allows to select a column in your raw data that contains e.g. line numbers or another guideline. When selected, the smoothening algorithm will only average those data that have the same guideline number. For example, consider that your data contains a column numbering the lines flown in a survey. When using this as a guideliner, the averaging and smoothing algorithm will only use rows of data having the same line number. This avoids overruns and interpolation between flight lines.