

Appearance
(V3.1) Dashboard
The dashboard is the default landing page when accessing the spectrometer. The page gives a basic insight into the measurements of the connected sensors, settings and detector information.
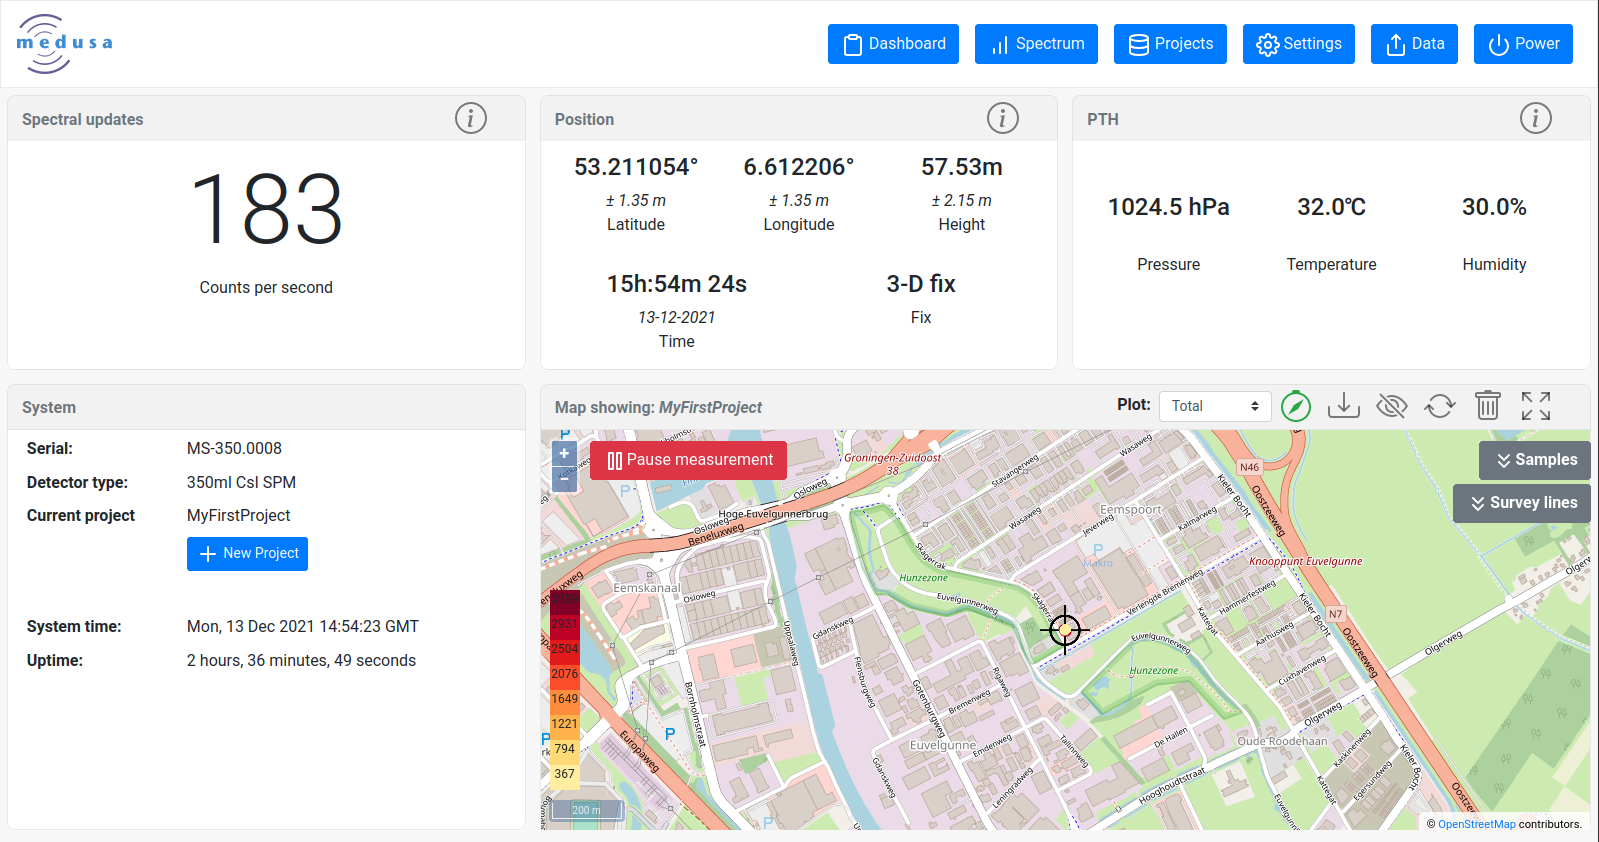
Sensor boxes
The table below describes the information boxes displayed on the Dashboard page. The sensor boxes contain an information icon ( ) in the top bar. By clicking on the information icon the sensor infobox is opened. Through this window, it is possible to inspect the incoming data.which is displayed in the Medusa defined JSON sensor format, described on the JSON documentation page.
| Box | Figure | Description |
|---|---|---|
| Spectral updates | 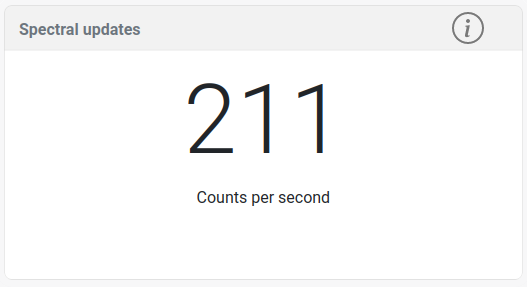 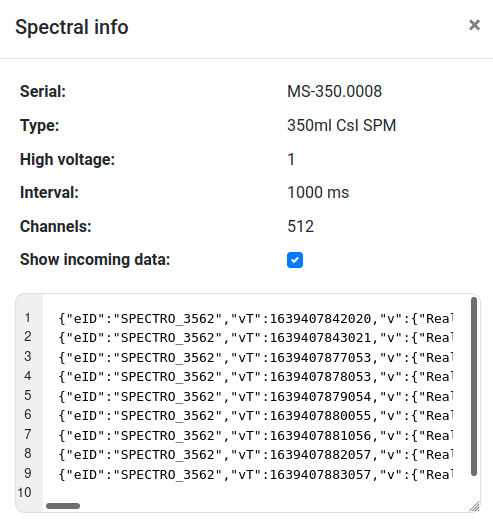 | A number displaying the live count rate measured by the scintillation crystal. |
| Position | 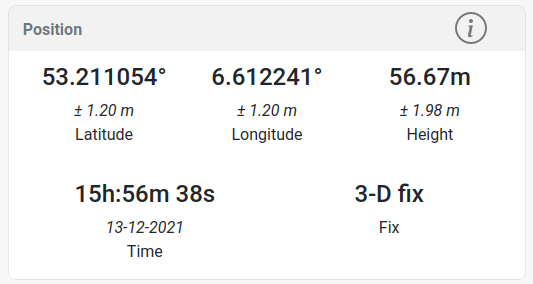 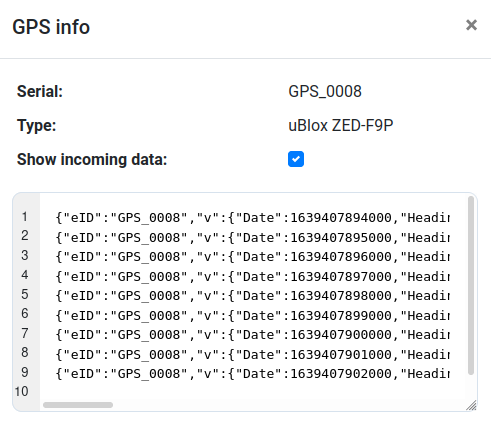 | Positional information. This can be recorded by the internal GPS or this can be the result of streaming the NMEA strings from an external GPS. |
| PTH | 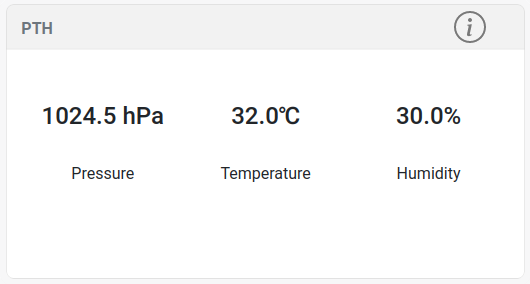 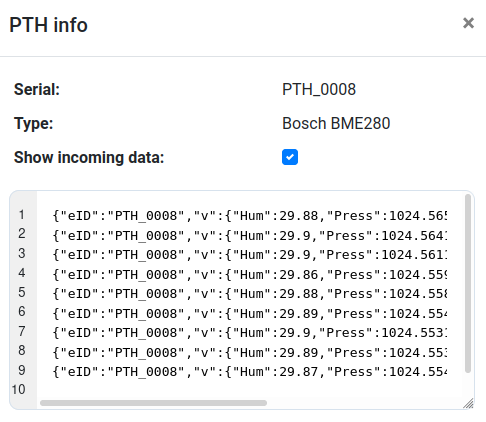 | Values for the Pressure, Temperature and Humidity sensors. |
| System | 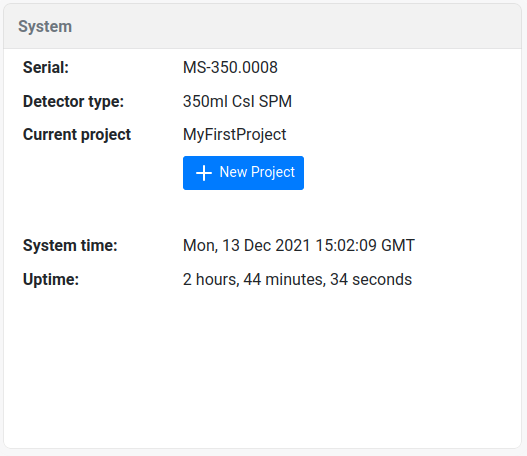 | System Information. A new project can be created through the button shown in this box, which is the same as creating a project on the Projects page. |
| Map | 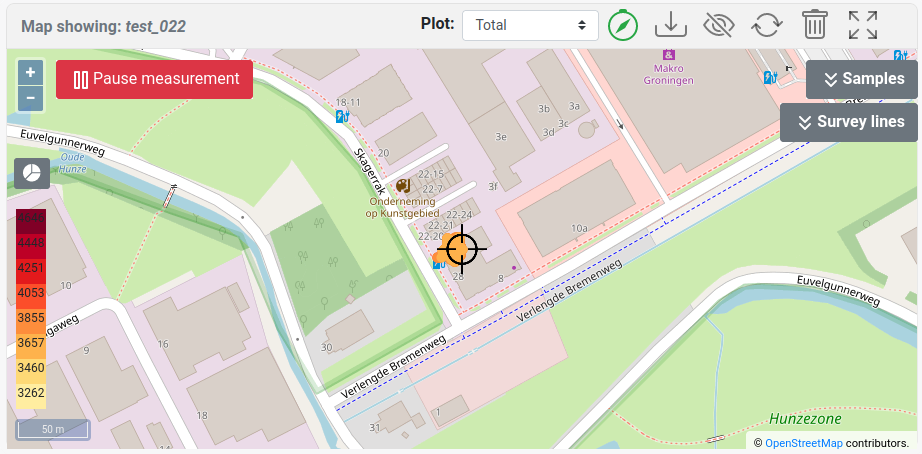 | Measurement values are plotted on a map. For a full description of the map component: see the mDOS map block page |