

Appearance
mDOS map block
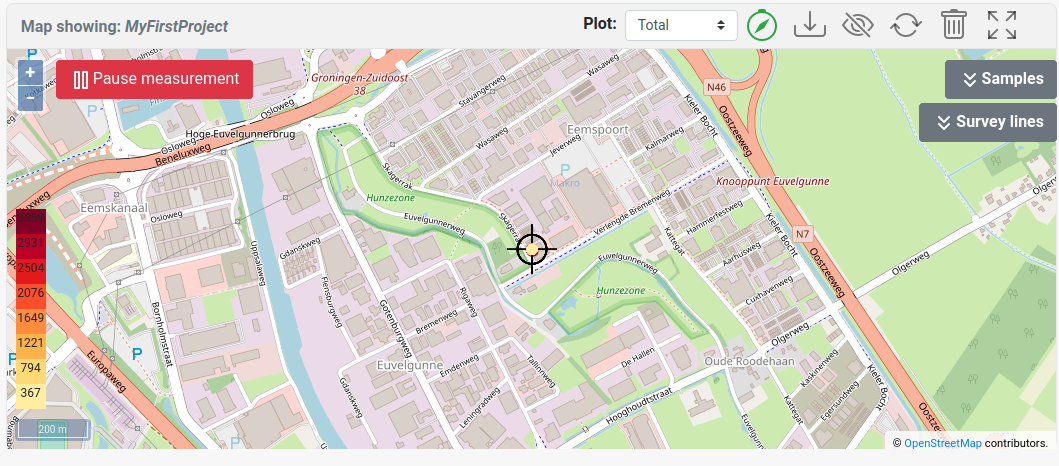
Map controls
| Icon | Description |
|---|---|
| Map Showing: <project name> | The project that is currently plotted on the map |
 | The z-value of the points plotted on the map. The z-value is plotted on a scale ranging from the minimum and maximum value present in the dataset |
 | Follow GPS: will center the map to each GPS position update |
 | Download background: this will download the map tile on the device so that no active internet connection is needed to render the background map |
 | Show/hide the online/offline map |
 | Reload the the points in the current view |
 | Delete all points in the current view |
 | Switch to fullscreen mode |
 | Pause the meausurement. Note that the detector will continue with collecting data, however data points are not plotted in the web viewer and these datapoints have been marked as 'paused' points. As a result, data collected when the device was in a pause mode can be retrieved from the project |
 | Open the sample panel (only visible on the dashboard page) |
 | Open the locations and sample panel (only visible on the project page) |
 | Open the Survey lines panel |
(locations and) samples
In a project, it might be desirable to take samples, either by doing a long measurement or by taking physical samples and sending these to a laboratory for analysis. The samples should be a good reflection of the variation in the area. The locations tool is used to calculate the best position for taking samples. This location suggestion takes the variation and size of the measured project into account.
Locations
| Locations | Description |
|---|---|
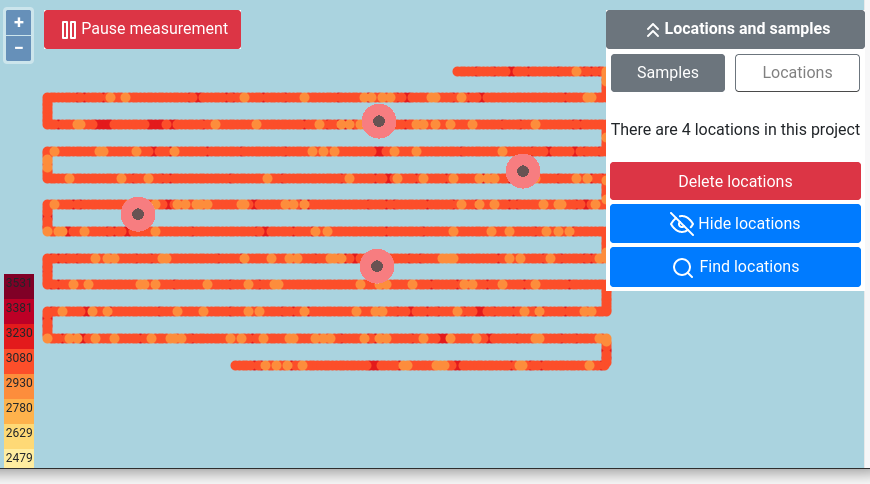 | The locations tab can be used to show/hide, delete and find locations. The Find locations button will open the panel below. The Delete locations will delete all locations present in the project. |
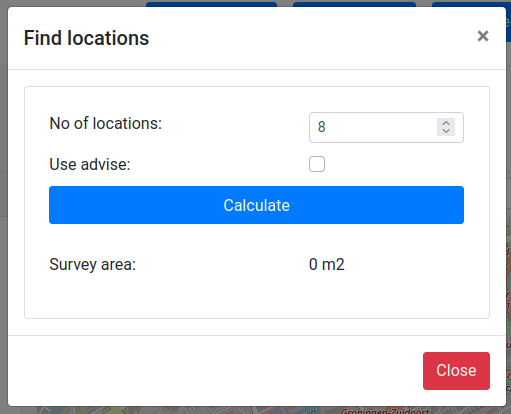 | Locations are suggestions for taking samples The find locations pop-up will load all the data collected in the project and use this data to calculate positions that are a good reflection of the variation in the field. The use advice option uses the project size to suggest a number of locations. After calculation, the locations are stored within the project and on a reload of the page, these locations will be visible. > Info > > |
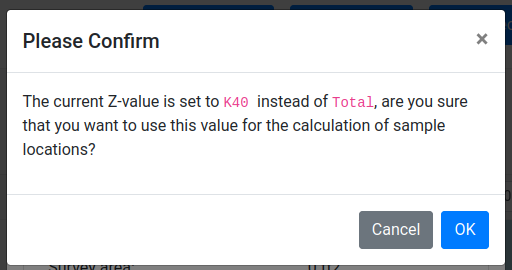 | The parameter used to calculate the sample locations is determined by the z-value selected in the map viewer. Usually, for the determination of the sample point, the 'total' value is used. If anything other than ' total ' is selected the shown pop-up will ask for confirmation. |
| [missing image: unknown] | Location marker that is shown on the map |
Samples
| Samples | Description |
|---|---|
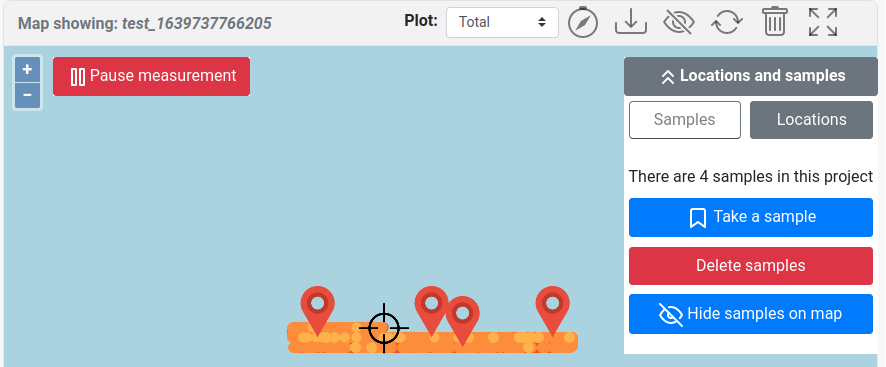 | The Samples tab can be used to show/hide, delete and take samples. The Take a sample button will open the panel below. The Delete samples button will delete all samples present in the project. Individual samples can be deleted in the sample table. |
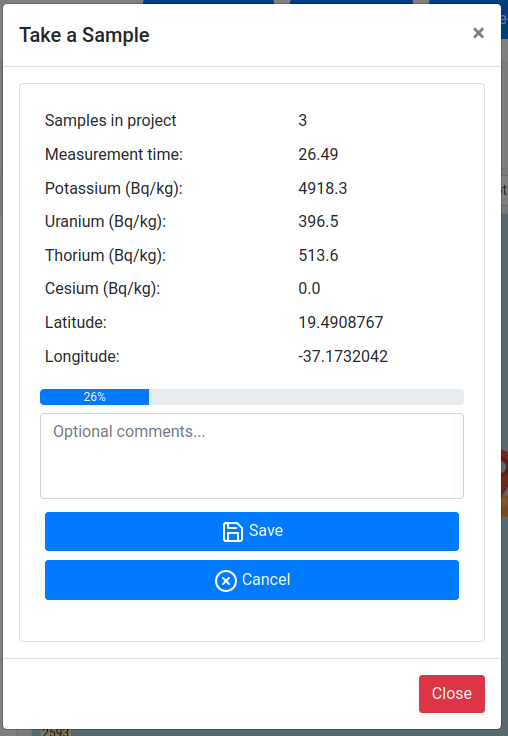 | The sample taking pop-up. Here a sample taking procedure can be started and finalized. The last known GPS position will be added to the sample. > Info > > The sample taking window can be closed while a sample is being taken. In the case when a sample is being taken, this pop-up will automatically be opened when navigating to the dashboard or project page. |
| [missing image: unknown] | Sample marker that is shown on the map |
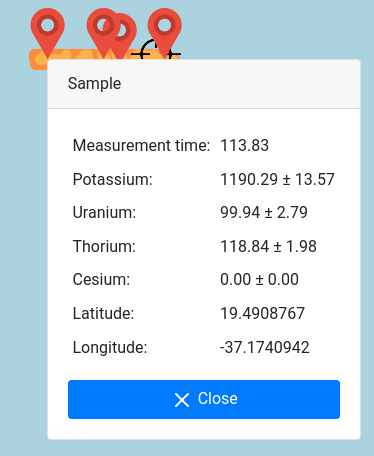 | By clicking on a sample marker the sample data can be inspected. |
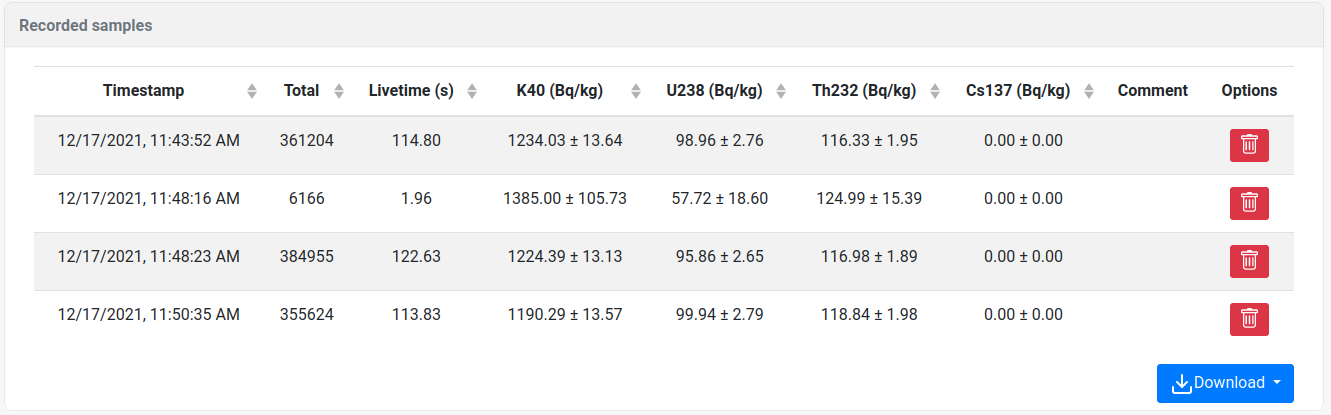 | The recorded samples table can be found at the bottom of the projects page. In this table the individual samples can be inspected and deleted. The samples can be downloaded (CSV or JSON format). The samples are always included in a full project download. |
Survey Lines
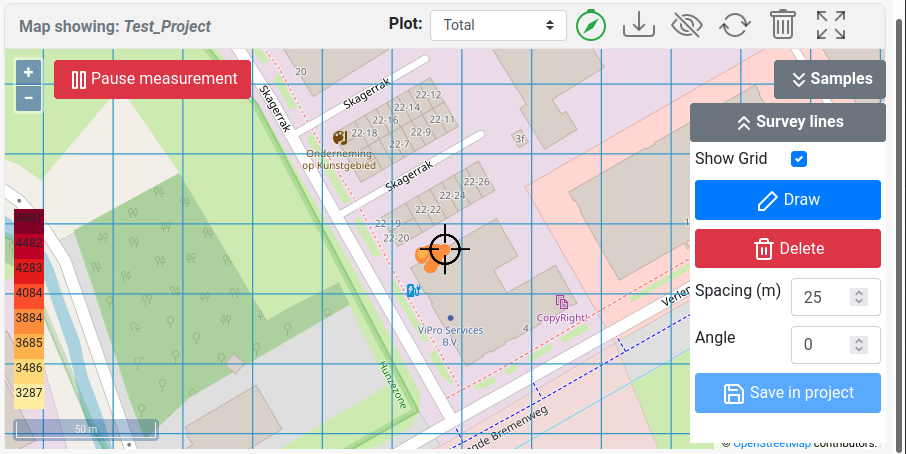
Enable/disable survey lines that can be used as reference points when doing a survey. The line spacing and angle of the survey lines can be specified.
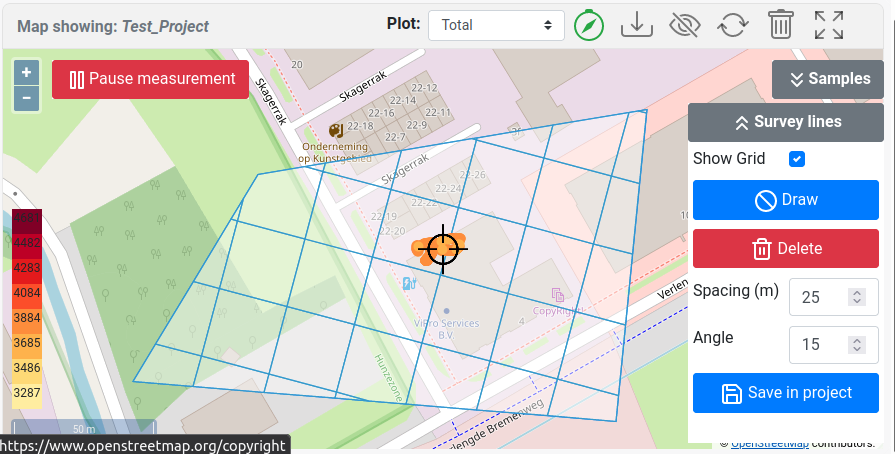
Additionally, it is possible to draw a boundary and generate a line spacing within this boundary. These boundaries are stored within the project.
Info
If the grid is not visible, try zooming in. This functionality is to prevent a drawing a line spacing when zoomed out.
| General line spacing | Line spacing in a bounding box |
|---|---|
 |  |