
First measurement
Your First Measurement
This chapter walks you through a complete measurement from start to finish. Each step is kept brief — links point to the relevant chapters if you need more detail on a particular topic.
Before starting, make sure the detector is powered and you have opened the mDOS interface in your browser. If you have not done this yet, see Connecting to the Detector.
Step 1 — Create a Project
The detector is always logging data to the active project. To keep your new measurement separate and easy to find, create a fresh project before heading out.
On the Dashboard, click Start new project. Enter a name and, optionally, a description, then confirm. The new project immediately becomes the active project and you are taken directly to the Survey page.
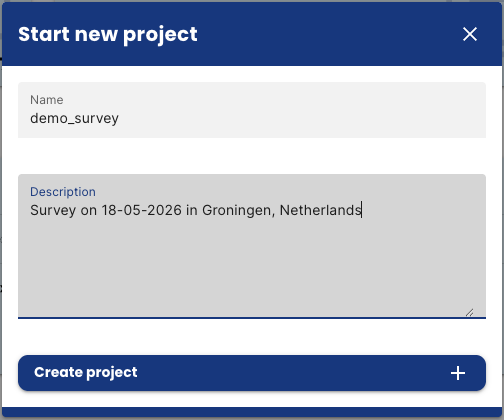
Note: Project names must be at least 4 characters and may only contain letters, numbers, and underscores. Each name must be unique.
For more on managing projects, see Project Management.
Step 2 — Verify the Sensors
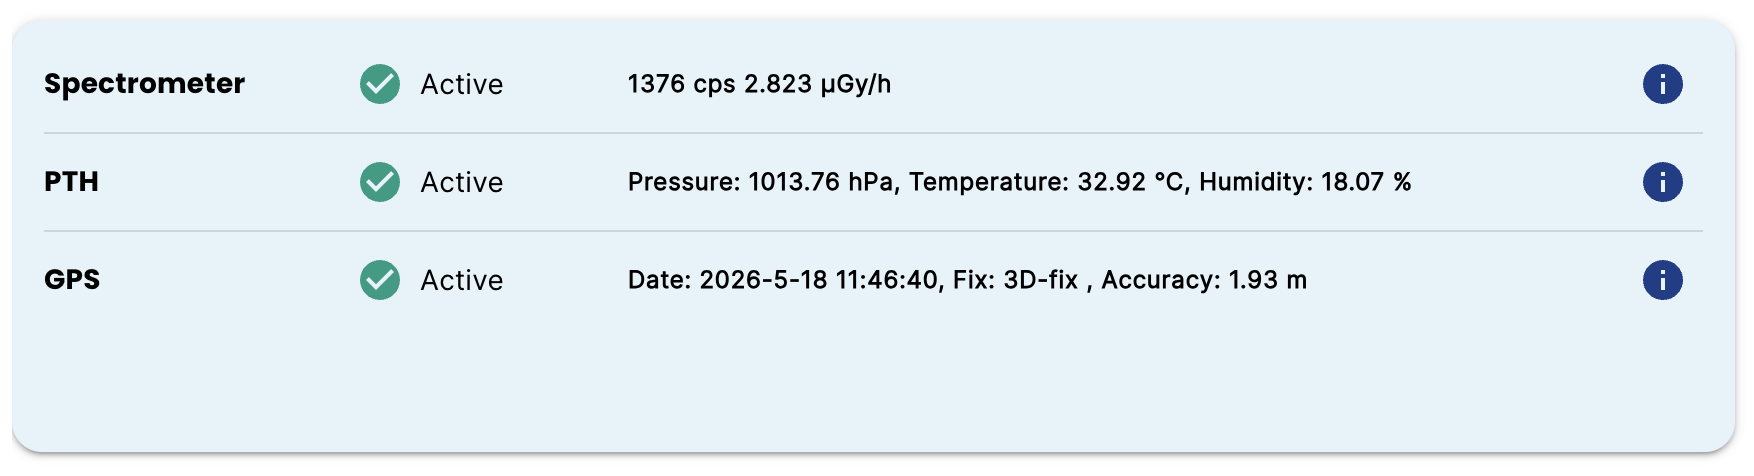
You are now on the Survey page. Before heading into the field, check that all sensors are working correctly using the sensor status indicators in the header, or navigate back to the Dashboard for a detailed view.
Sensor | What to check |
|---|---|
Spectrometer | Shows a count rate (cps). If the header shows "The spectrometer is stabilizing", wait for stabilization to complete before expecting dose rate and radionuclide concentrations. |
GPS | Shows a fix type and accuracy. Wait for a 3D-fix before starting the survey — data without a GPS fix will not be georeferenced. |
PTH | Shows pressure, temperature, and humidity. |
The spectrometer stabilizes automatically every time the detector starts. This typically takes a few minutes depending on the crystal size and ambient radiation level.
Step 3 — Go Out and Collect Data
Once the active project is set and GPS has a fix, you are ready to measure. The detector logs data continuously — there is no start button. Data is recorded even when the measurement is paused, but paused data is marked separately and not plotted on the map.
Navigate to the Survey page using the sidebar. The map shows your current GPS position as a crosshair, and data points appear on the map as you move.
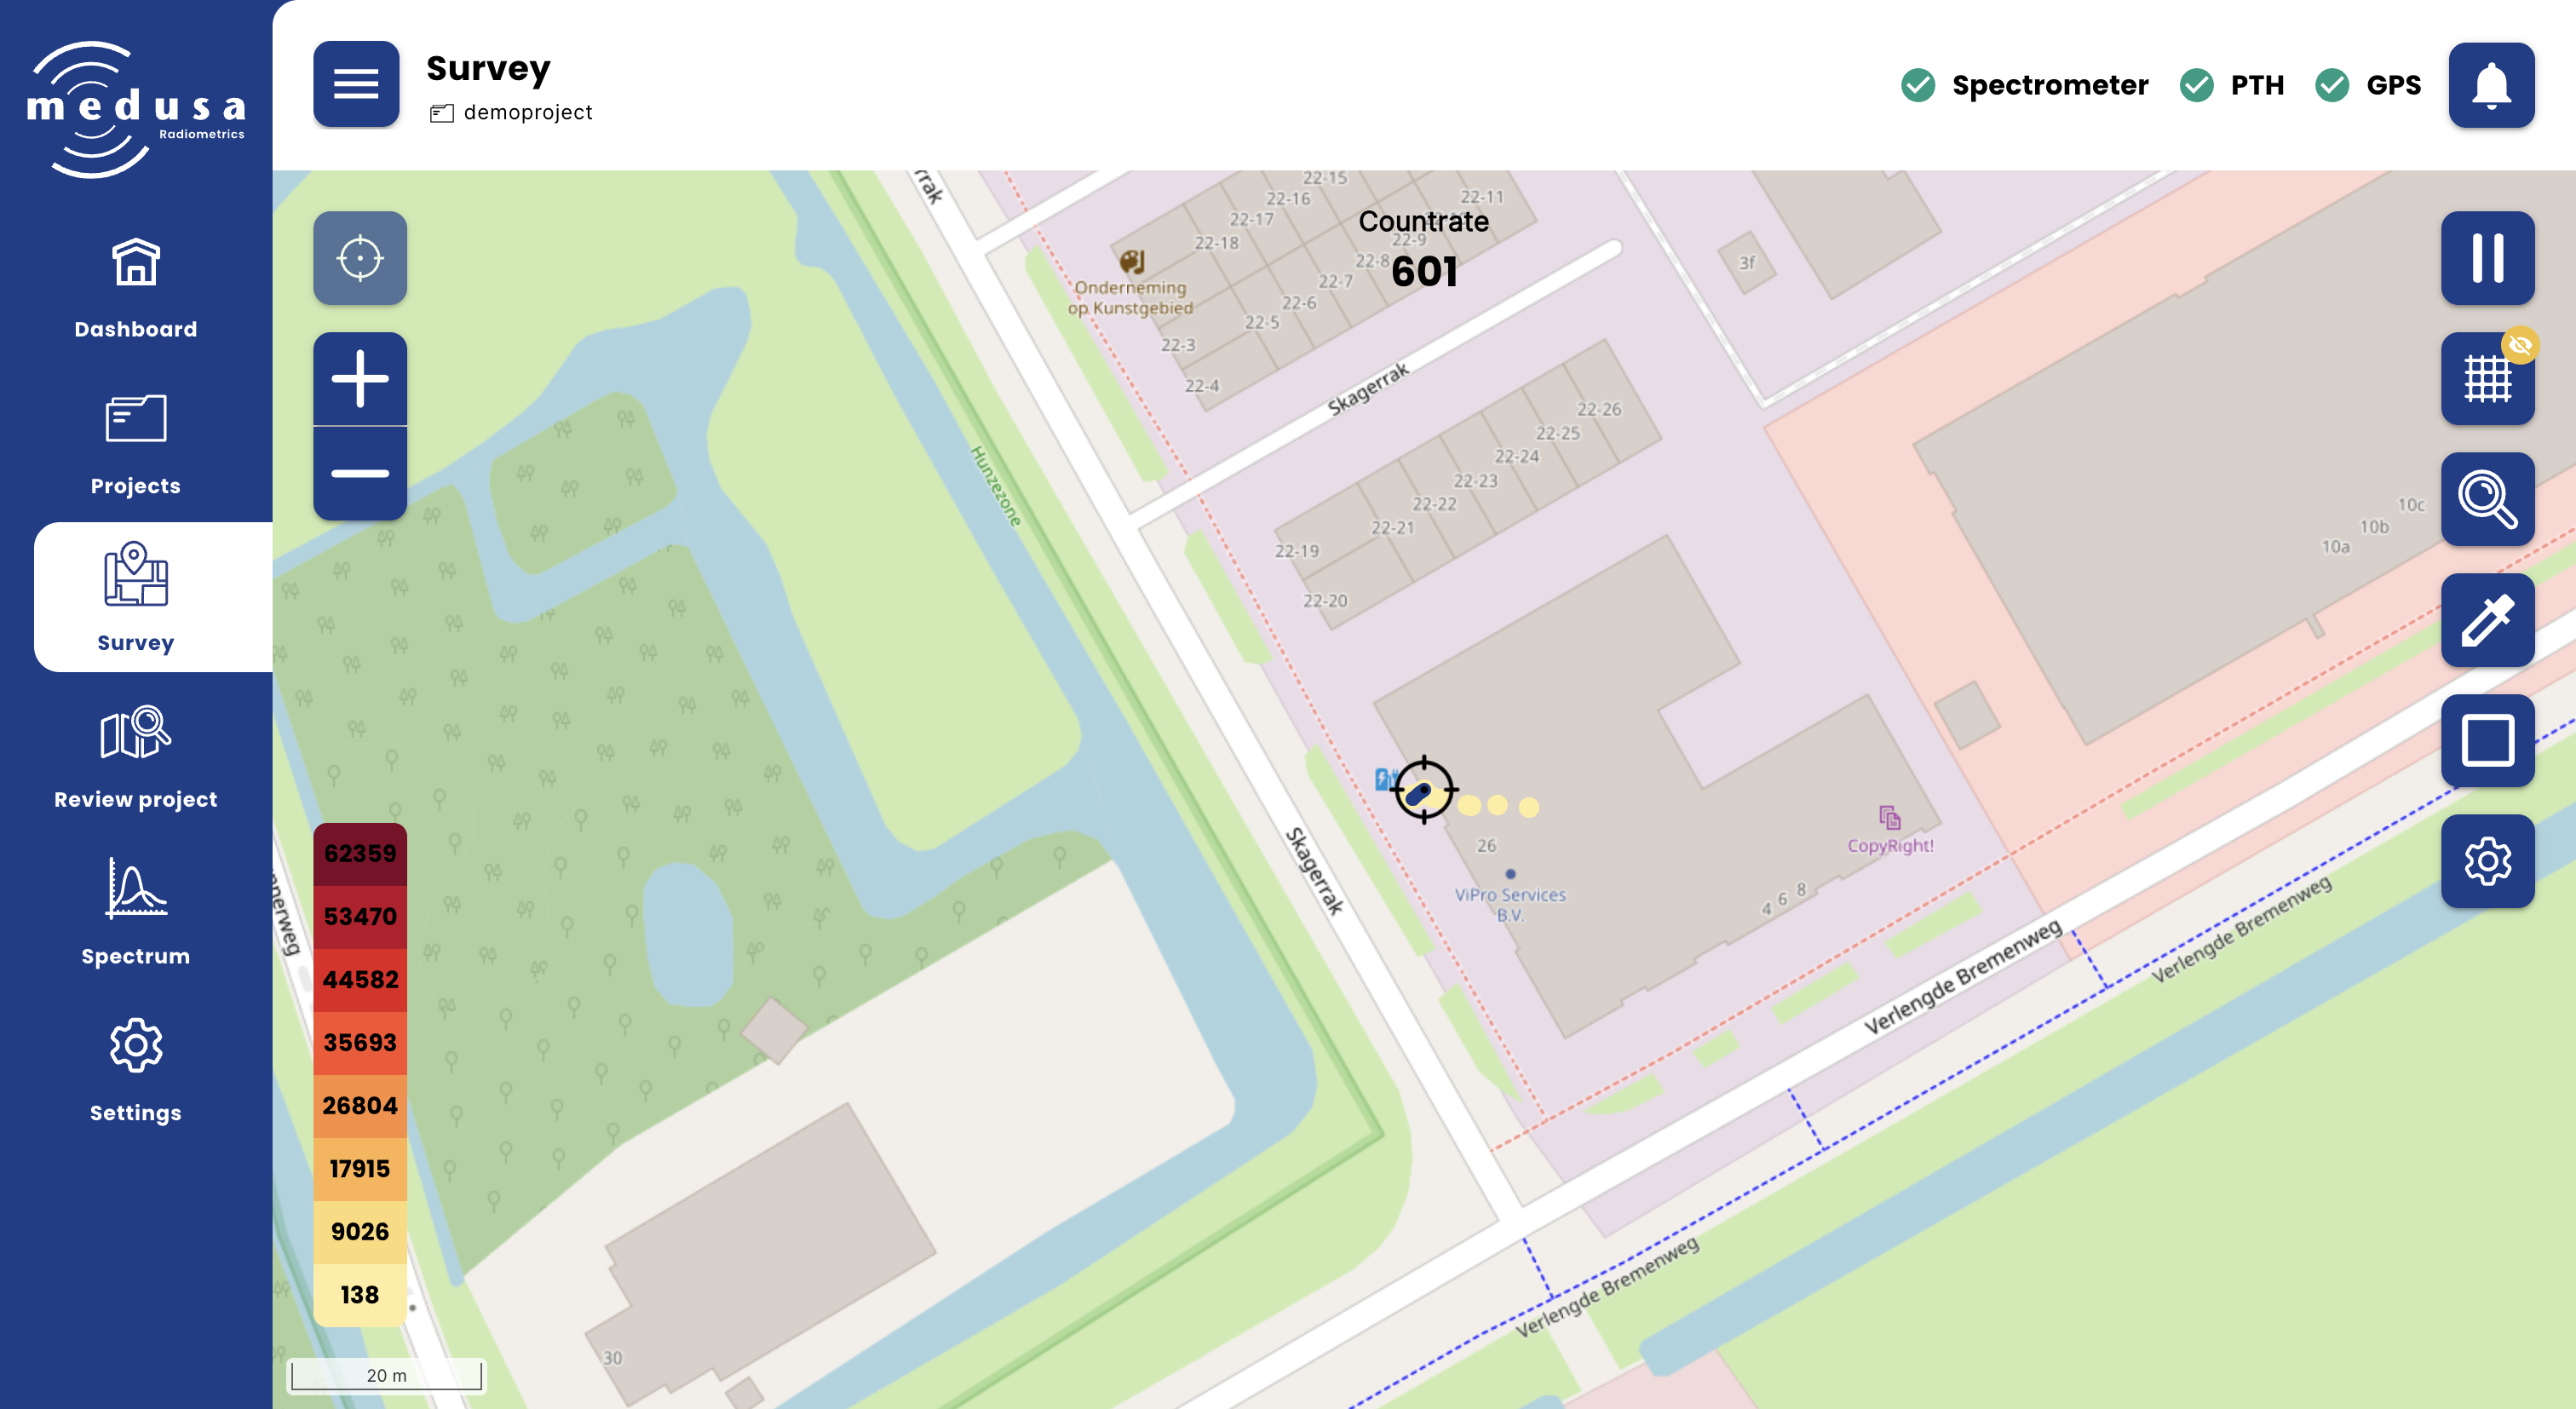
The colour of each data point reflects the count rate at that location. The colour scale on the left side of the map shows the range of values currently visible.
The SCN LED on the detector blinks for every stored spectrum, and the AUX LED blinks for every GPS and PTH entry — a quick way to confirm that logging is working without opening the interface.
For a full description of the Survey page and its tools, see Conducting a Survey.
Step 4 — Download Your Data
When the measurement is complete, navigate to Projects in the sidebar. Find your project and click the download button.
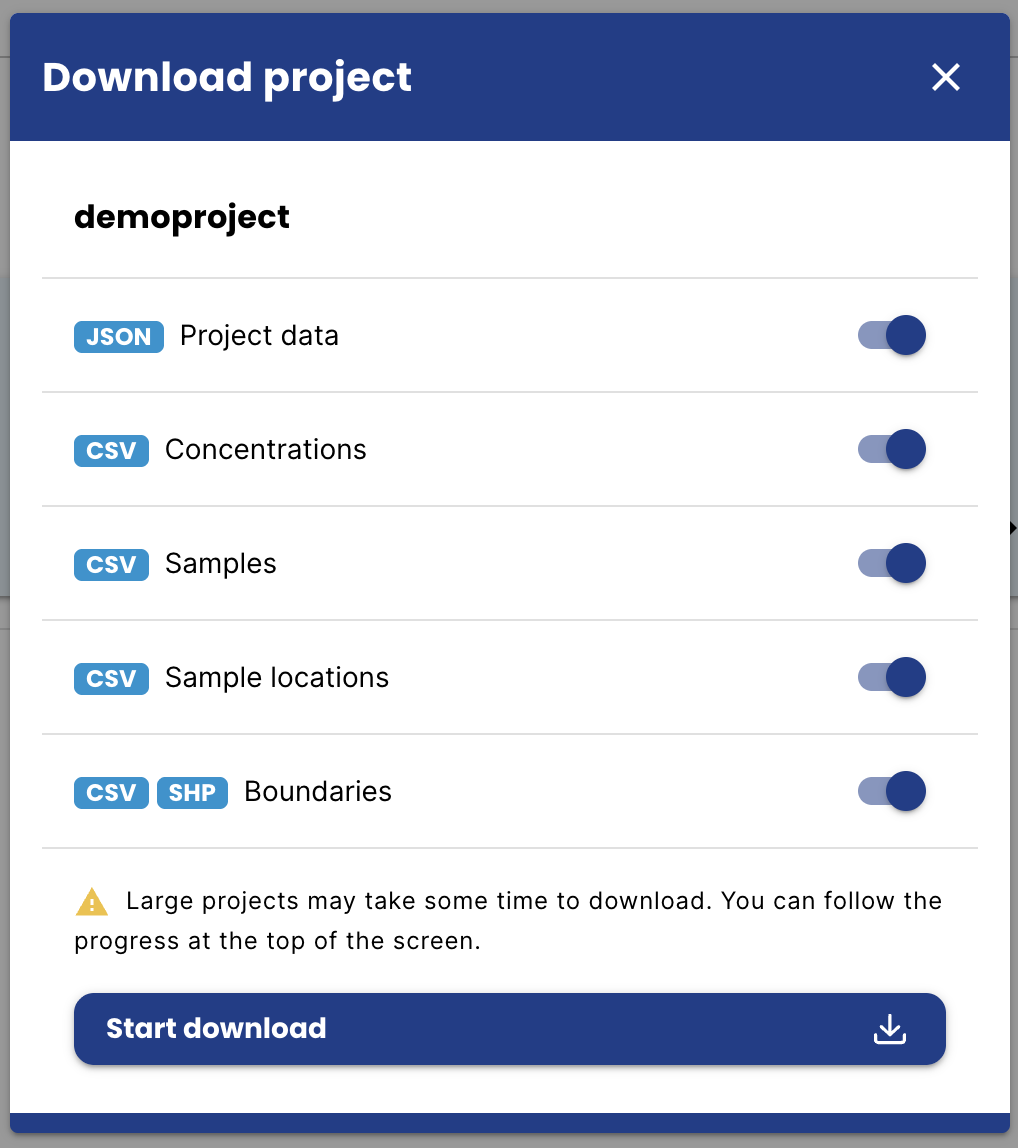
A dialog appears where you can select which data to include. Click Start download — the detector compresses the project into a zip file and your browser downloads it automatically.
For a full description of download options and file formats, see the Project Management page.
Step 5 — Power Off
Remove the power cable to shut down the detector. There is no shutdown procedure — data is written continuously and no data will be lost when power is removed.