Appearance
Interface Overview
Before diving into measurements, it helps to know your way around the mDOS interface. This chapter explains the elements that appear on every page, how to navigate between pages, and what the LED indicators on the detector itself mean.
The Header
The header runs across the top of every page in the interface.

| Element | Description |
|---|---|
| Page title | The name of the page you are currently on |
| Active project | Shown below the page title — the project that data is currently being logged to |
| Sensor status indicators | Top right corner — a quick overview of the current status of the Spectrometer, PTH, and GPS |
| Notification bell | Top right corner — opens the notifications panel |
| Stabilization progress | Shown in the header whenever the spectrometer is stabilizing, for example: "The spectrometer is stabilizing (50%)". The percentage updates in real time. |
| Measurement paused | A yellow banner reading "Measurement Paused" is shown in the header whenever the measurement is paused. Data is still being recorded but is marked as paused. |
Stabilization is the automatic self-calibration process of the sensors and is performed each time the detector is powered on. Radionuclide concentrations are only displayed after the stabilization process has been completed. Depending on the crystal size and ambient radiation levels, this typically takes a few minutes. See Viewing the Spectrum for a detailed explanation of what stabilization is and why it is needed.
Navigation
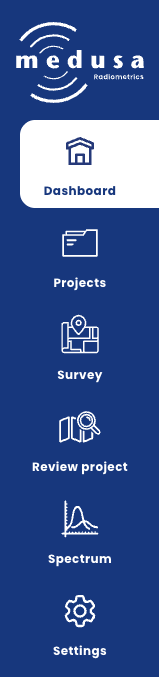
The sidebar on the left gives access to all pages in the interface. It is available on every page.
| Page | Description |
|---|---|
| Dashboard | Sensor status, project shortcuts, and quick links |
| Projects | Create, continue, review, and download projects |
| Survey | Live map view for field measurements |
| Review project | Explore recorded data from any project on a map without affecting the active project |
| Spectrum | Live spectrum plot and radionuclide concentrations |
| Settings | System, sensor, WiFi, map, and communication settings |
Sensor Status Indicators
The sensor status indicators in the header give a real-time overview of each sensor. The same indicators appear in more detail on the Dashboard.
All sensors share the following statuses:
| Icon | Status | Description |
|---|---|---|
 | Unknown | No data has been received from this sensor since the detector started |
 | Inactive | No data has been received for longer than 10 times the configured interval |
 | Active | The sensor is working normally |
The Spectrometer and GPS have additional statuses:
Spectrometer
| Icon | Status | Description |
|---|---|---|
 | Stabilizing | The spectrometer is collecting counts to calculate the energy stabilization. Progress is shown in the header. |
GPS
| Icon | Status | Description |
|---|---|---|
 | No antenna | The GPS antenna is not connected |
 | No signal | The GPS is running but no satellites are detected |
| Acquiring | Satellites detected, but no GPS fix established yet |
The Dashboard
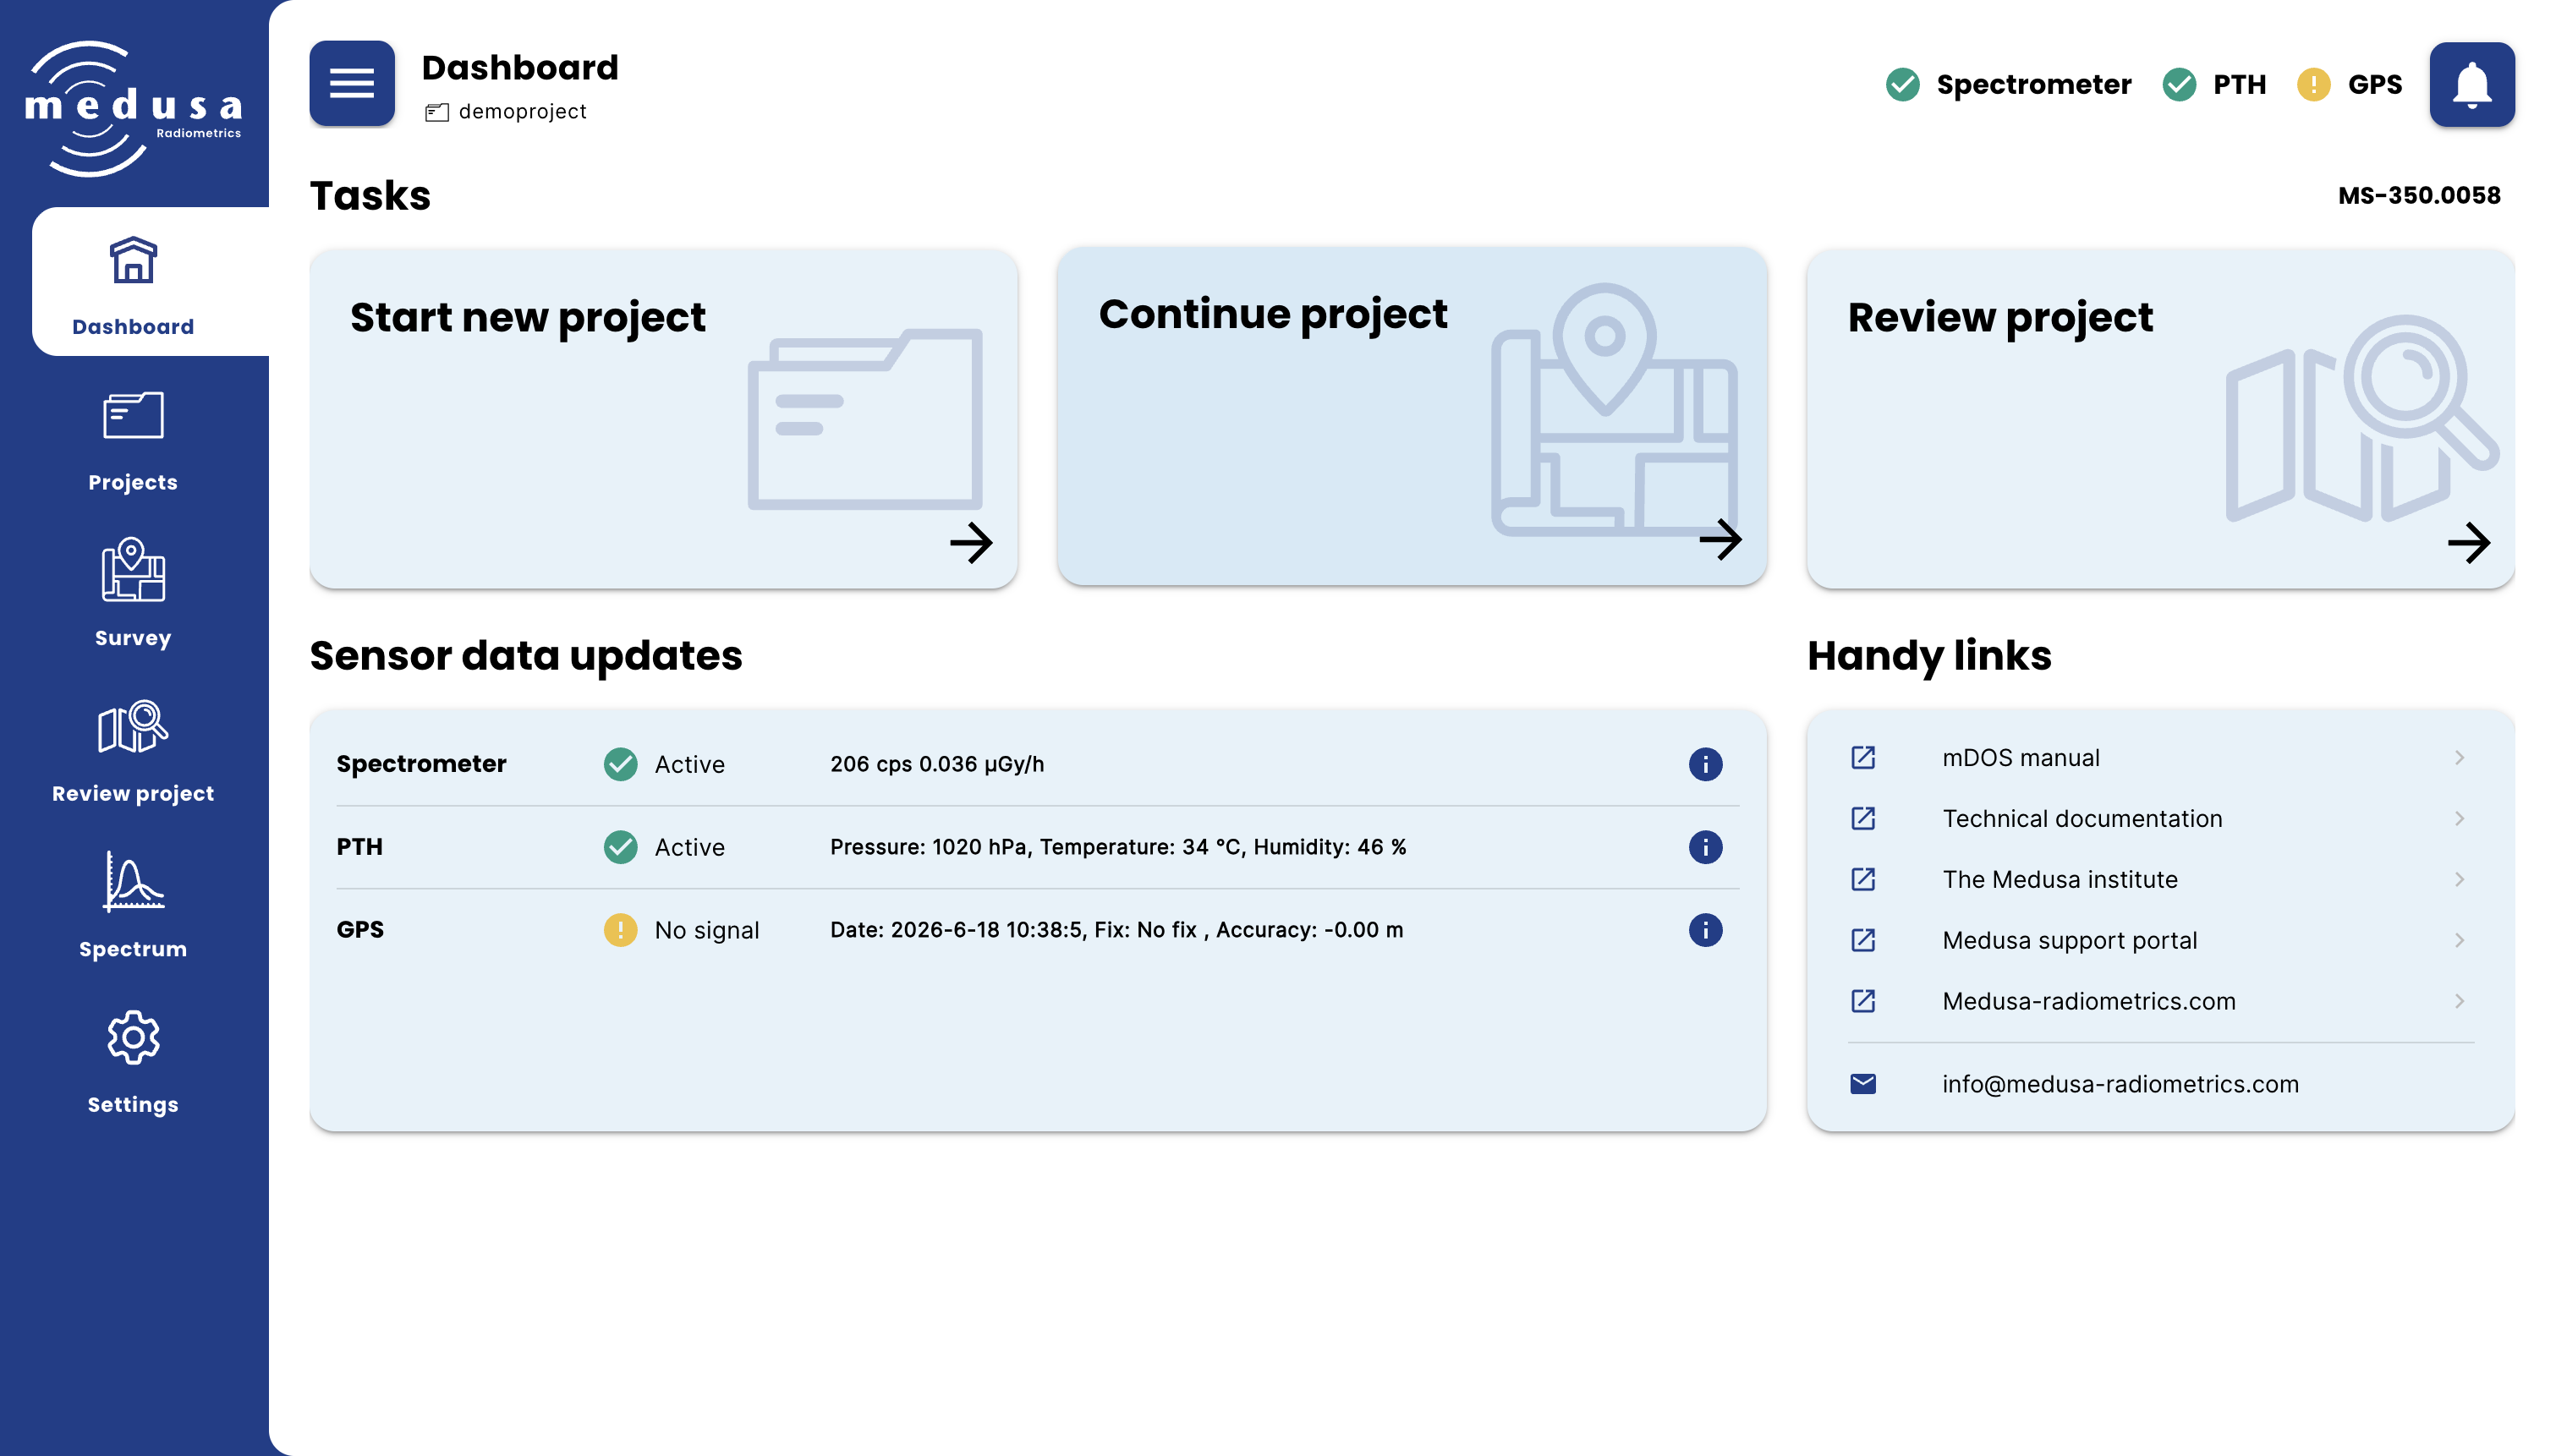
The Dashboard is the landing page after the welcome screen. It is divided into three sections.
Tasks
The Tasks section provides shortcuts to the three main workflows.
| Task | Description |
|---|---|
| Start new project | Opens a form to create a new project, which immediately becomes the active project |
| Continue project | Opens a list of existing projects — selecting one makes it the active project |
| Review project | Opens a project in the Review project page for inspection |
Sensor Data
The Sensor data section shows the latest reading from each connected sensor.
| Sensor | Data shown |
|---|---|
| Spectrometer | Count rate (cps) and dose rate (µGy/h) |
| PTH | Pressure (hPa), Temperature (°C), Humidity (%) |
| GPS | Date, fix type, accuracy (m) |
| Altitude | Height (m) — only shown when an external altitude source is active (Lidar or NMEA with RMZ messages). Incoming height data is displayed live in this row. |
| RS232 | Only shown when an RS232 input mode is active (RTCM, CSV, JSON, or Text) — displays the incoming data on the serial port live in this row. |
Info
Note: The dose rate is only displayed once the spectrometer has stabilized. The count rate is always shown.
Each sensor row has an info button ( ) on the right. Clicking it opens a panel with the sensor type, measurement interval, and a live data stream showing the most recent JSON strings received from that sensor.
Handy Links
The Handy links section provides quick access to this manual, the Medusa technical documentation, the support portal, and the Medusa Radiometrics website.
Notifications
The notification bell in the header  shows a badge when there are unread notifications. Clicking it opens a panel with recent notifications. All notifications can also be viewed on the dedicated Notifications page.
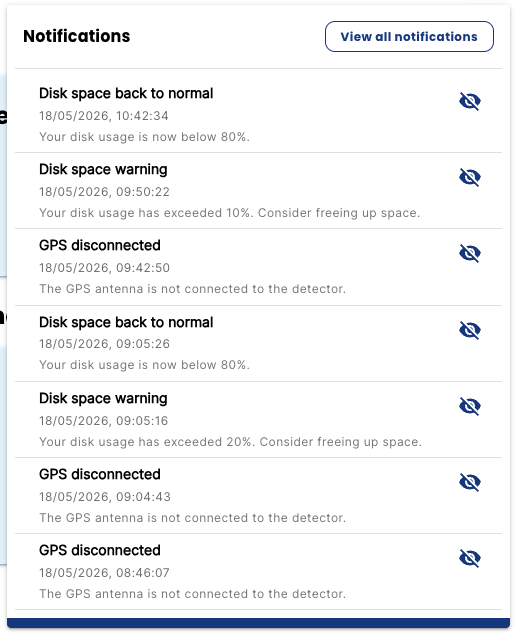
Notifications are generated automatically by the detector when something requires your attention. The following events trigger a notification:
| Notification | Trigger |
|---|---|
| Sensor data alert | A sensor has not received data for longer than 10 times the configured interval — the sensor is now considered inactive |
| Disk space warning | Storage usage has exceeded the configured threshold percentage |
| Disk space back to normal | Storage usage has dropped back below the threshold |
| GPS disconnected | The GPS antenna has been disconnected from the detector |
| Disk full — writing stopped | The storage is completely full and the detector has stopped logging new data (only occurs when Overwrite files when full is disabled) |
Each notification shows a title, timestamp, and short description. Notifications can be marked as read individually or all at once using Mark all as read.
Note: The disk space threshold and the overwrite behaviour can be configured under Settings → System → Storage.
LED Indicators on the Detector
The detector has four LEDs on the top cap. Their position relative to the connector depends on the detector model — some are mounted with the wings down (e.g. MS-2000), others with the wings up (e.g. MS-350, MS-1000).
| LED | Colour | Meaning |
|---|---|---|
| PWR | Green | Input voltage is OK |
| Red | Input voltage is too low | |
| Red blinking (1 Hz) | Input power could not be measured | |
| Blue | Input voltage is too high — internal electronics may be at risk | |
| Purple | Input voltage has large fluctuations — check the power supply | |
| ETH | Green | Connected to a network (Ethernet or Wi-Fi) |
| Blue | Connected to a network with active internet access | |
| SCN | Yellow | A raw spectrum is being collected |
| Green | A spectrum has been stabilized, analysed, and stored | |
| AUX | Yellow | A PTH reading is collected and stored |
| Green | A GPS reading is collected and stored | |
| Blue | An auxiliary reading is collected (external sensor) |
Warning: If both the SCN and AUX LEDs blink red, the internal storage is almost full. The threshold and the action taken when storage is full can be configured under Settings → System → Storage. The default action is to overwrite the oldest inactive project.
The PWR LED not being green shows the last issue detected since the last power cycle, even after the underlying condition has cleared. A red, blue or purple LED therefore does not confirm the problem is still occurring, it may reflect something that happened earlier in that same session. Power cycling the detector resets the LED, and it will turn green again if the voltage is correct at that point.