

Appearance
Conducting a Survey
The Survey page is the main working view during a field measurement. It shows all recorded data on a live map, follows your GPS position, and gives access to tools for taking samples, marking boundaries, and navigating the field.
Navigate to Survey in the sidebar to open it. The name of the active project is shown in the header — all data collected while on this page is logged to that project.
Before You Go
Before heading into the field, run through this checklist:
The correct project is active (shown in the header)
The GPS status indicator shows a fix — data collected without a GPS fix will not be georeferenced
The spectrometer has stabilized — dose rate and radionuclide concentrations are only available after stabilization
If you need an offline map: download it before leaving — see Downloading an Offline Map
The Survey Map
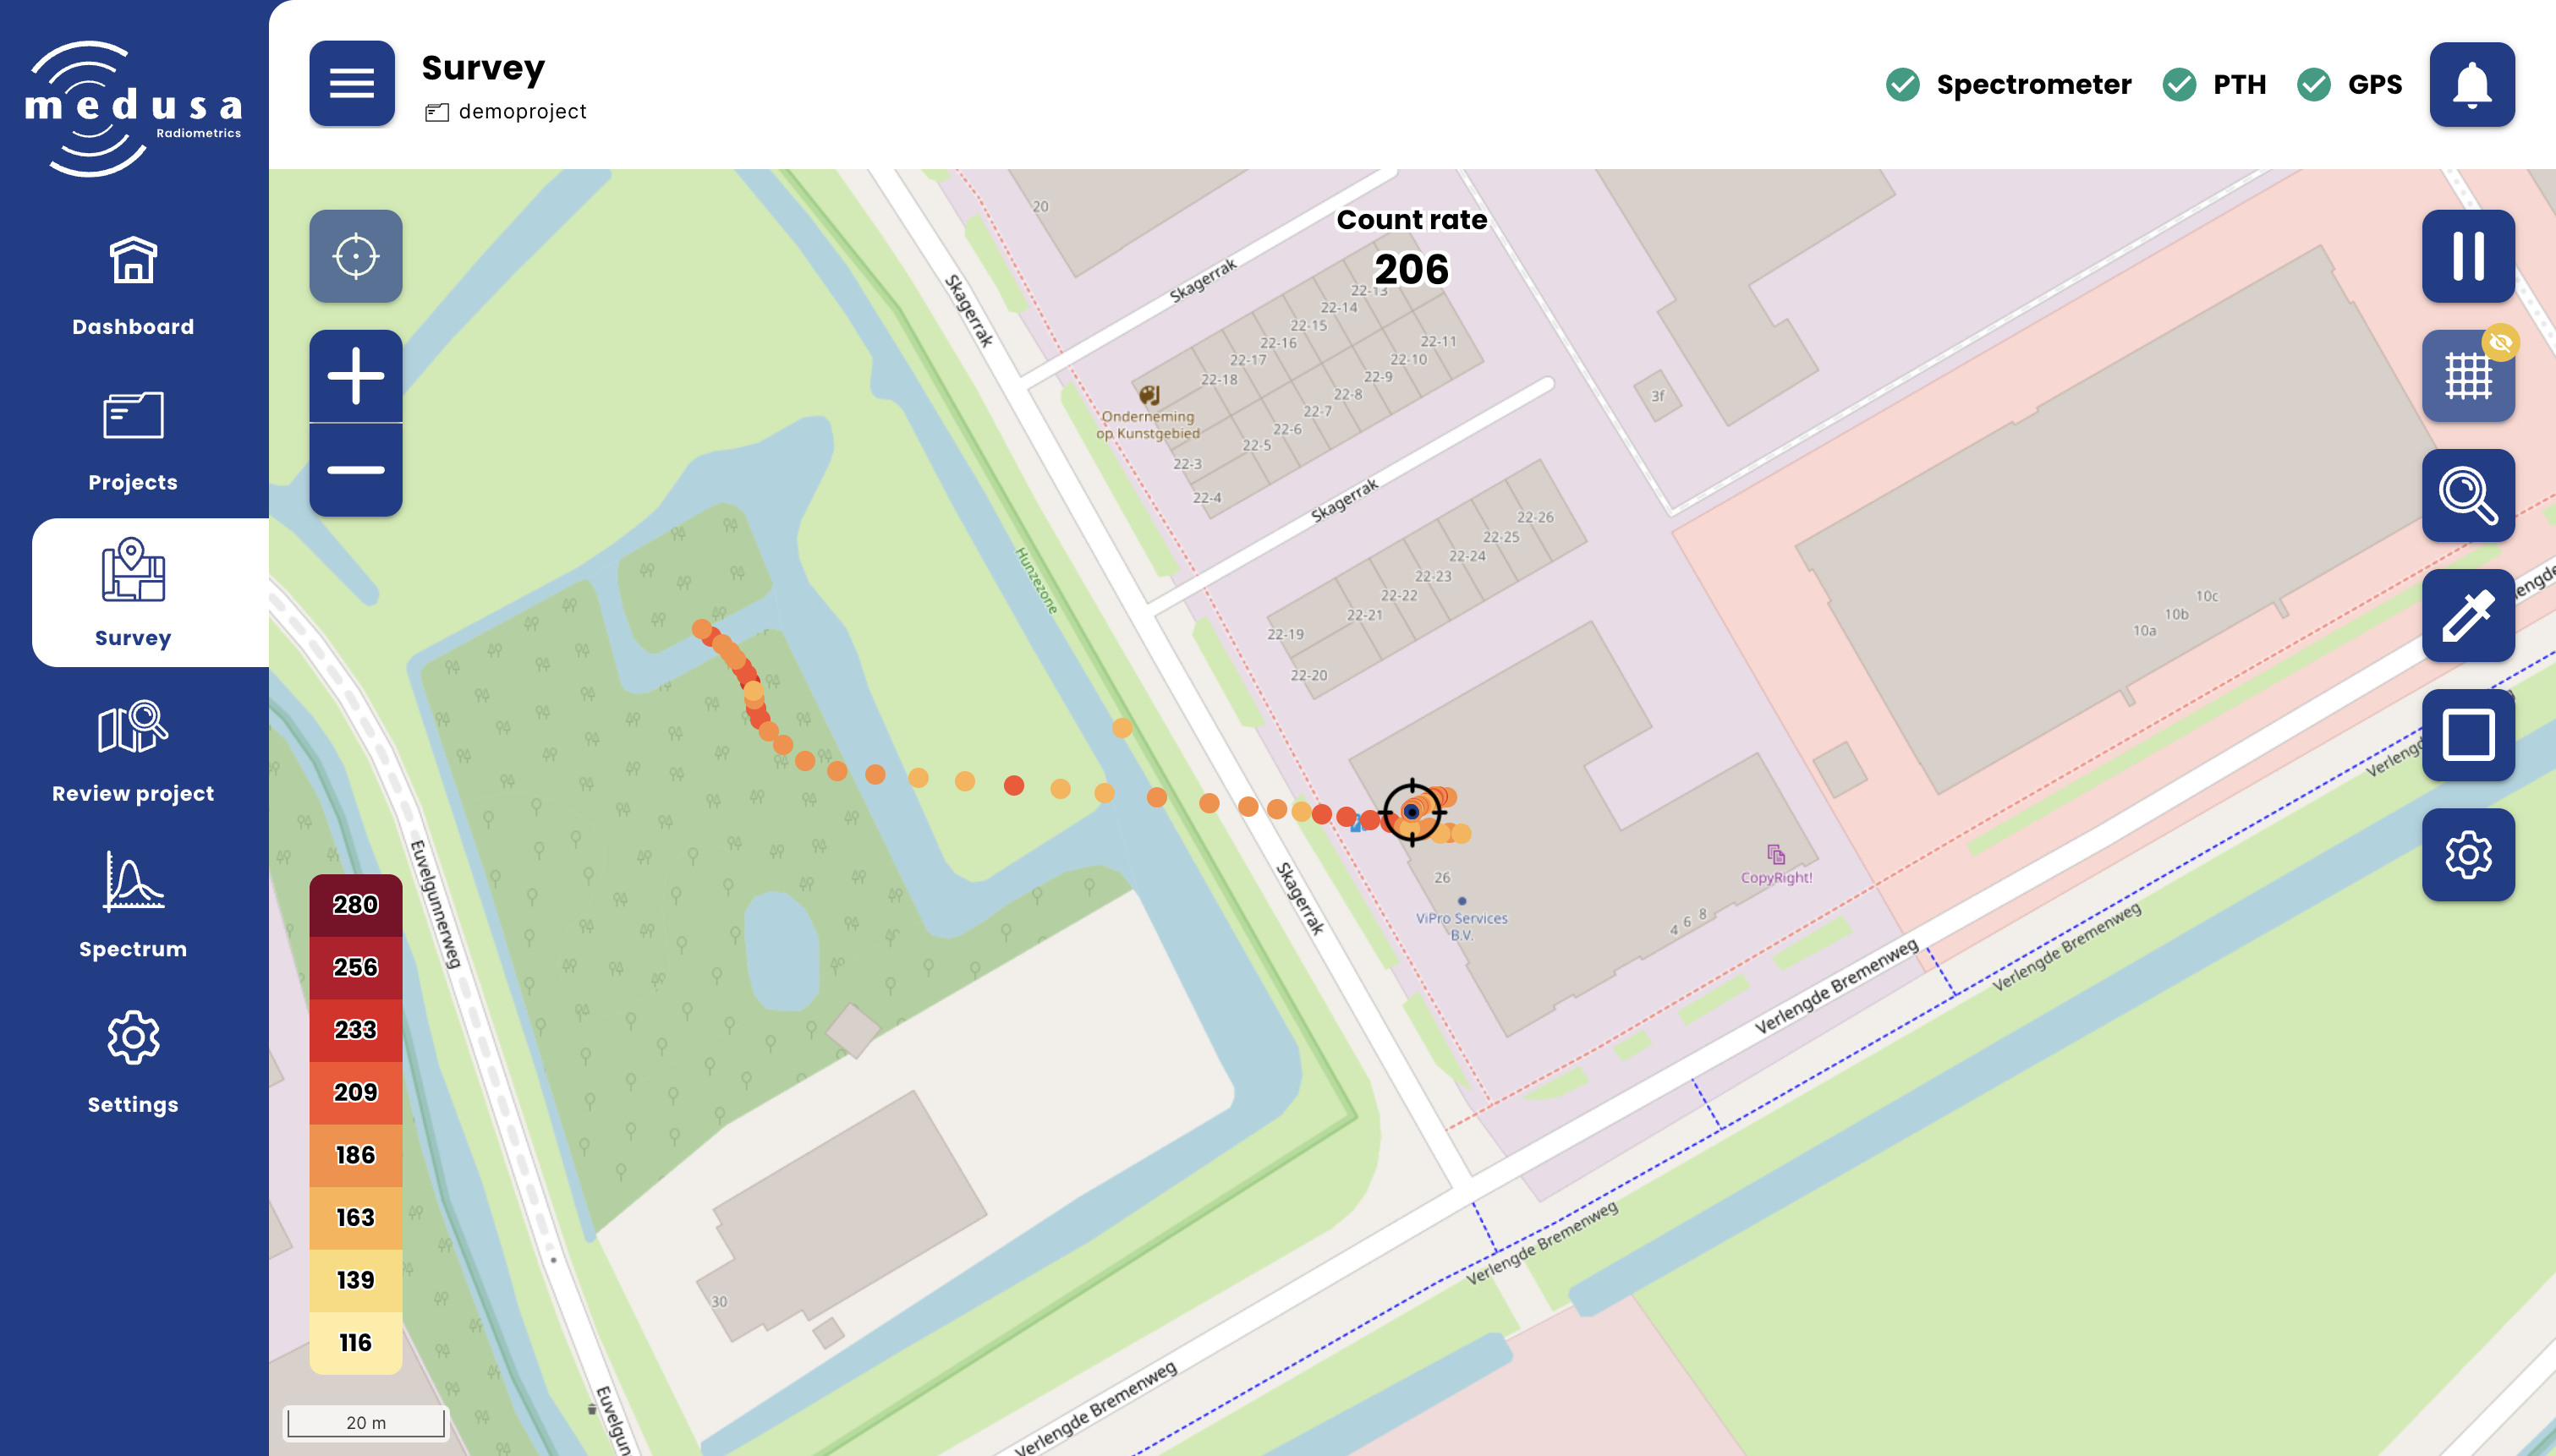
The map plots all data from the active project. Each data point is colour-coded by count rate (cps). The colour scale on the left side of the map shows the range of values currently visible.
Your current GPS position is shown as a crosshair on the map. The current count rate is displayed at the top of the map. The map follows your position automatically — if you pan the map manually, it recentres on your GPS position after 30 seconds. Panning again resets that timer.
Paused data is still recorded but is not plotted on the map.
Map Controls
Left Toolbar
| Icon | Button | Description |
|---|---|---|
 | Centre on GPS | Recentres the map on your current position and re-enables GPS following |
 | Zoom in | Zoom in on the map |
 | Zoom out | Zoom out on the map |
Right Toolbar
| Icon | Button | Description |
|---|---|---|
 | Pause | Pauses the measurement. Data continues to be recorded but is marked as paused and not plotted on the map. |
 | Grid | Opens the Grid panel |
 | Sample locations | Opens the Sample locations panel |
 | Take a sample | Opens the Sample panel |
 | Boundary | Opens the Boundaries panel |
 | Map settings | Opens the Map Settings Panel |
Pausing and Resuming
Press the Pause button in the right toolbar to pause the measurement. The detector continues recording data, but paused data is marked separately and not shown on the map. A yellow "Measurement Paused" banner appears in the header as a reminder that the measurement is paused.
Press the button again to resume. This is useful when moving between fields or when the measurement should not include a particular stretch of the route.
Using the Survey Grid
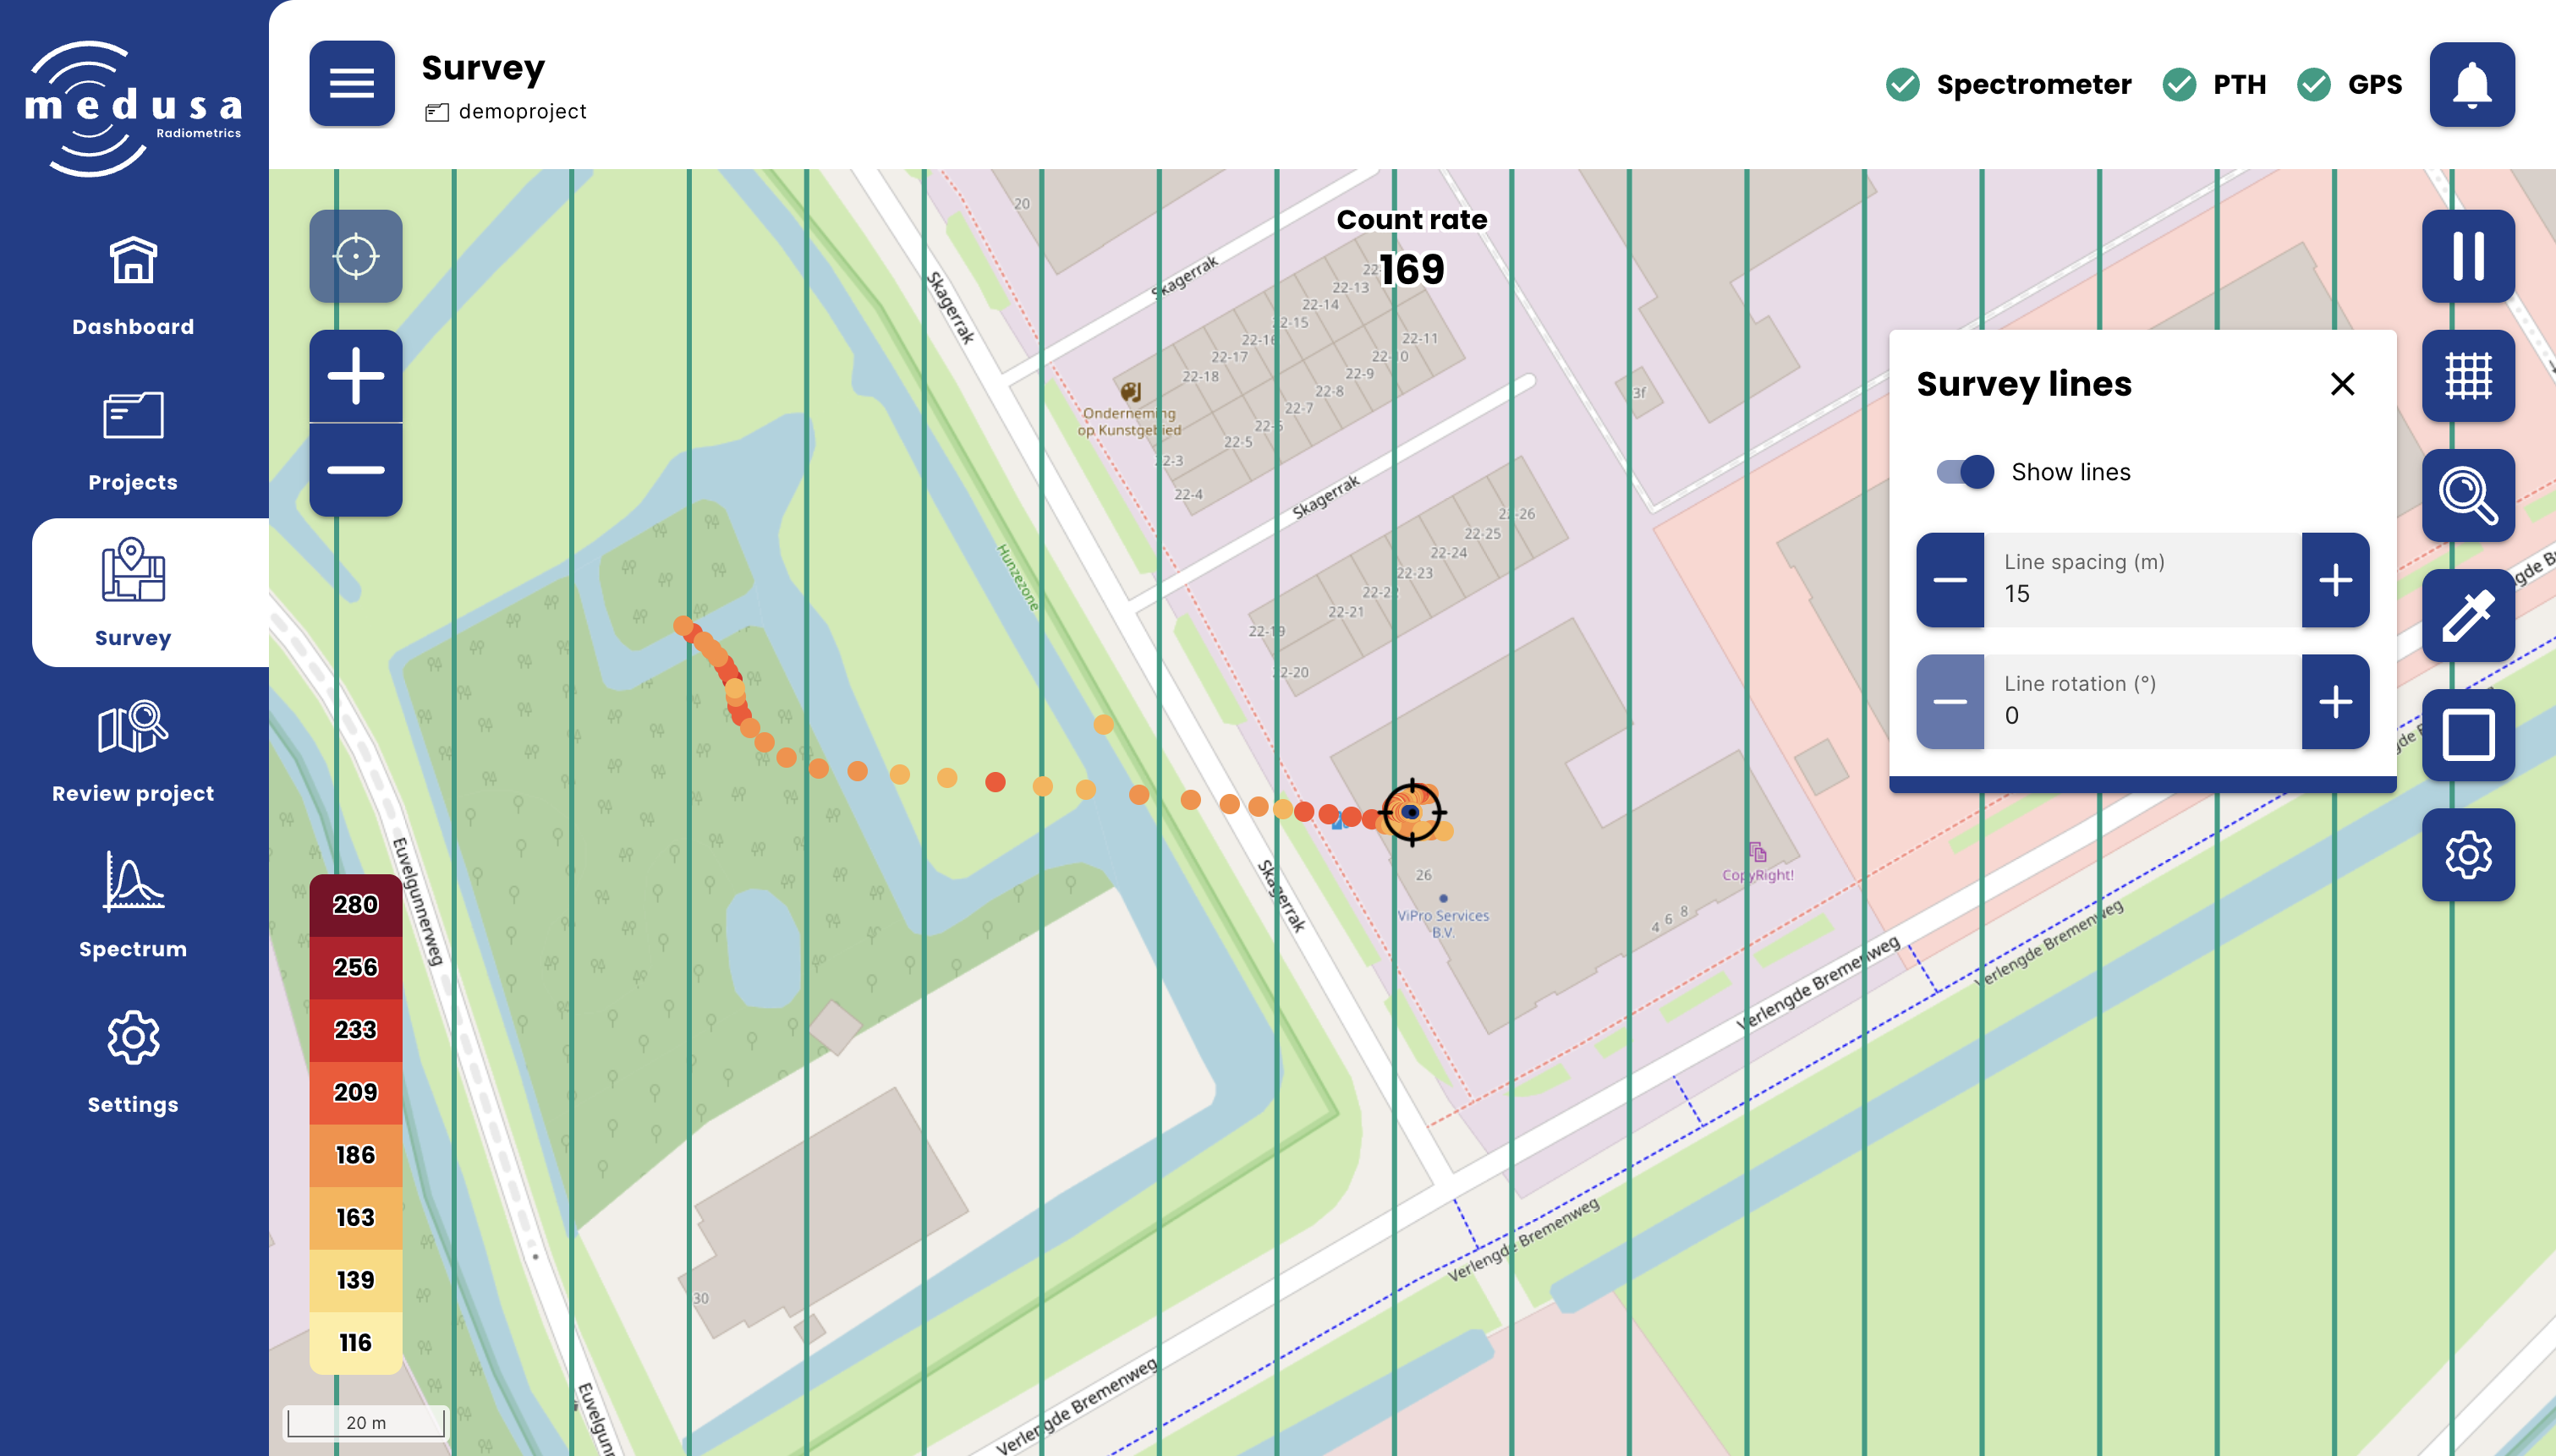
The grid panel overlays a configurable reference grid on the map. This helps you maintain consistent line spacing during a survey.
| Setting | Description |
|---|---|
| Show grid | Toggle to show or hide the grid |
| Grid spacing (m) | The distance between grid lines in metres |
| Grid rotation (°) | The rotation of the grid in degrees |
Grid settings are stored per device in the browser. If the grid is not visible after enabling it, try zooming in.
Taking Samples
Samples are point measurements taken at a specific location. While a sample is being recorded, incoming spectra are summed over a set time period, then analysed and stored together with the current GPS position.
Samples are useful for correlating field measurements with soil parameters determined in a laboratory, or for taking a longer stationary measurement at a specific location.
The nuclides included in a sample are determined by the active nuclides configured under Settings → Sensors → Spectral. Make sure the correct nuclides are active before taking samples.
Info
Note: A sample record contains an energy-stabilized and analysed spectrum. It does not contain the raw spectrum and cannot be re-analysed in Gamman.
Starting a Sample Measurement
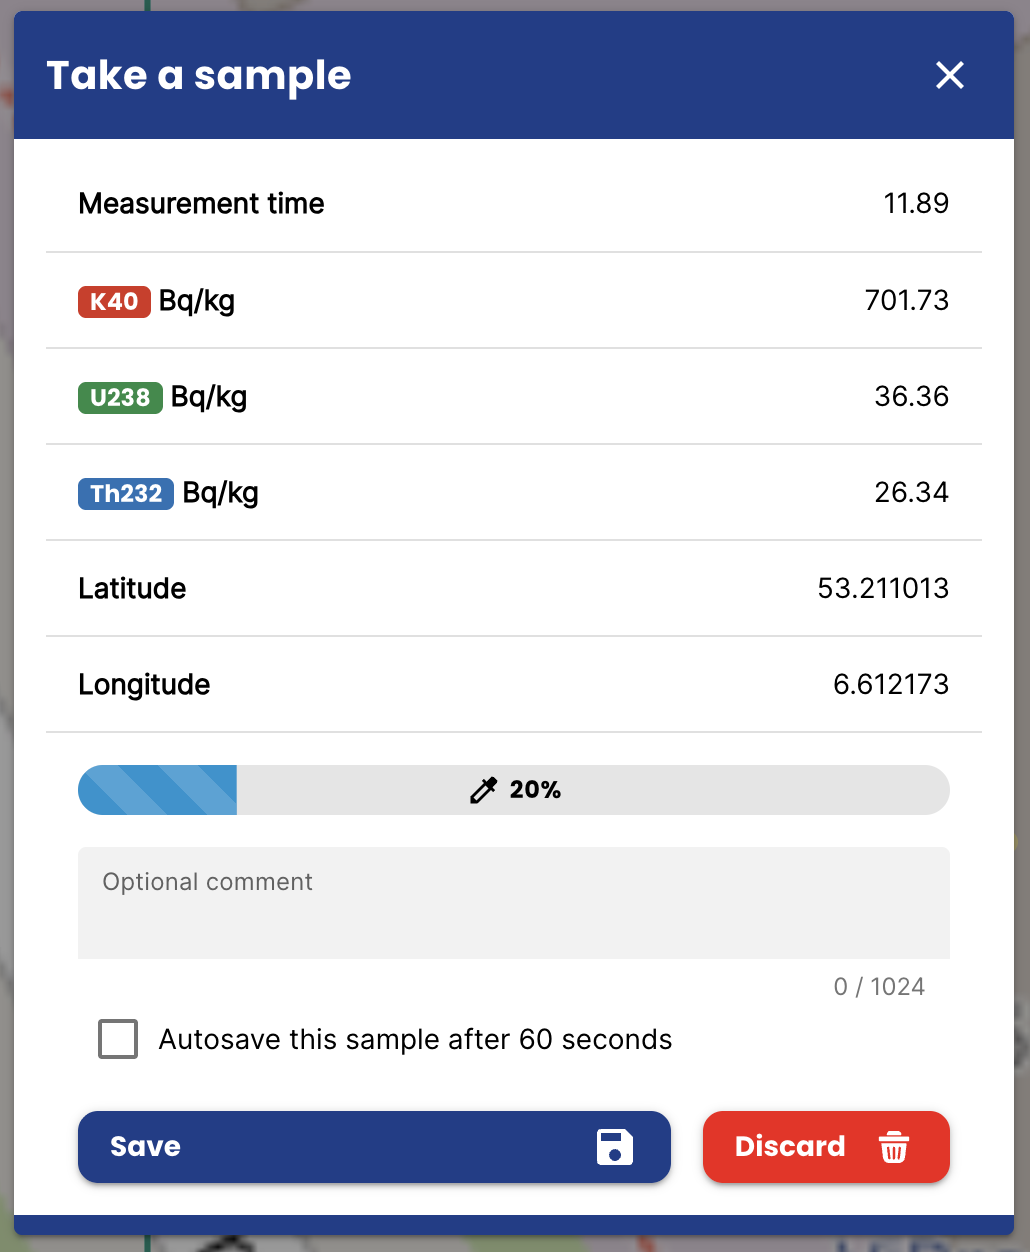
Open the Take a sample panel from the right toolbar and click Take a sample. While the measurement is in progress, the following information is shown in real time:
| Field | Description |
|---|---|
| Measurement time | Elapsed time in seconds |
| K40 / U238 / Th232 | Live activity concentration in Bq/kg |
| Latitude / Longitude | The GPS position that will be saved with the sample |
| Progress bar | Progress towards the configured measurement time |
| Comment | An optional comment (max 1024 characters) |
| Autosave | When enabled, the sample is saved automatically when the measurement time is reached |
Click Save to store the sample, or Discard to cancel without saving.
The default sample duration is 60 seconds and can be changed under Settings → Map → Samples.
Managing Samples
| Action | Description |
|---|---|
| Show samples | Toggle to show or hide recorded samples on the map |
| Delete samples | Remove a single sample or delete all samples from the project |
Determining Sample Locations
The Sample locations panel manages suggested positions for taking soil samples using a smart algorithm. These suggestions are calculated to give a good spatial representation of the variation found in the surveyed field using a smart algorithm.
| Action | Description |
|---|---|
| Show locations | Toggle to show or hide sample locations on the map |
| Find locations | Calculate suggested locations automatically |
| Upload locations | Upload predefined locations from a file |
| Delete locations | Remove a single location or delete all locations |
Calculating Locations Automatically
Click Find locations to open the calculation dialog.
| Setting | Description |
|---|---|
| Use sample advice | When enabled, the number of locations is determined by a predefined density (e.g. 1 sample per 8 ha). When disabled, enter the desired number manually. |
| Include texture advice | When enabled, the algorithm also identifies points suitable for texture analysis. |
| Find locations using | Current view — uses only the data visible on screen. Complete project — uses all data in the project. |
Info
Note: When using Current view, zoom in on a specific part of the field to calculate locations for that area only.
The sampling density used by the Use sample advice option can be configured under Settings → Map → Samples.
Uploading Predefined Locations
Locations can be uploaded as a CSV or JSON file (maximum 100 KB, maximum 250 locations).
CSV format — the file must contain a header row with lat or latitude and lon or longitude columns (case insensitive):
csv
latitude,longitude
53.210963,6.612039
53.211048,6.612187
JSON format — the following formats are all supported:
json
[{ "lat": 53.210963, "lon": 6.612039 }]The Medusa sample CSV format (downloaded from a project) can also be uploaded directly.
Recording Boundaries
The Boundary panel records the outline of the surveyed area as you walk the perimeter. The boundary is saved separately in the project and can be used to automate data cleaning. Recording an boundary is optional in a survey.
Click New boundary to start recording. Your GPS coordinates are shown in real time and the boundary is drawn live on the map as you move.
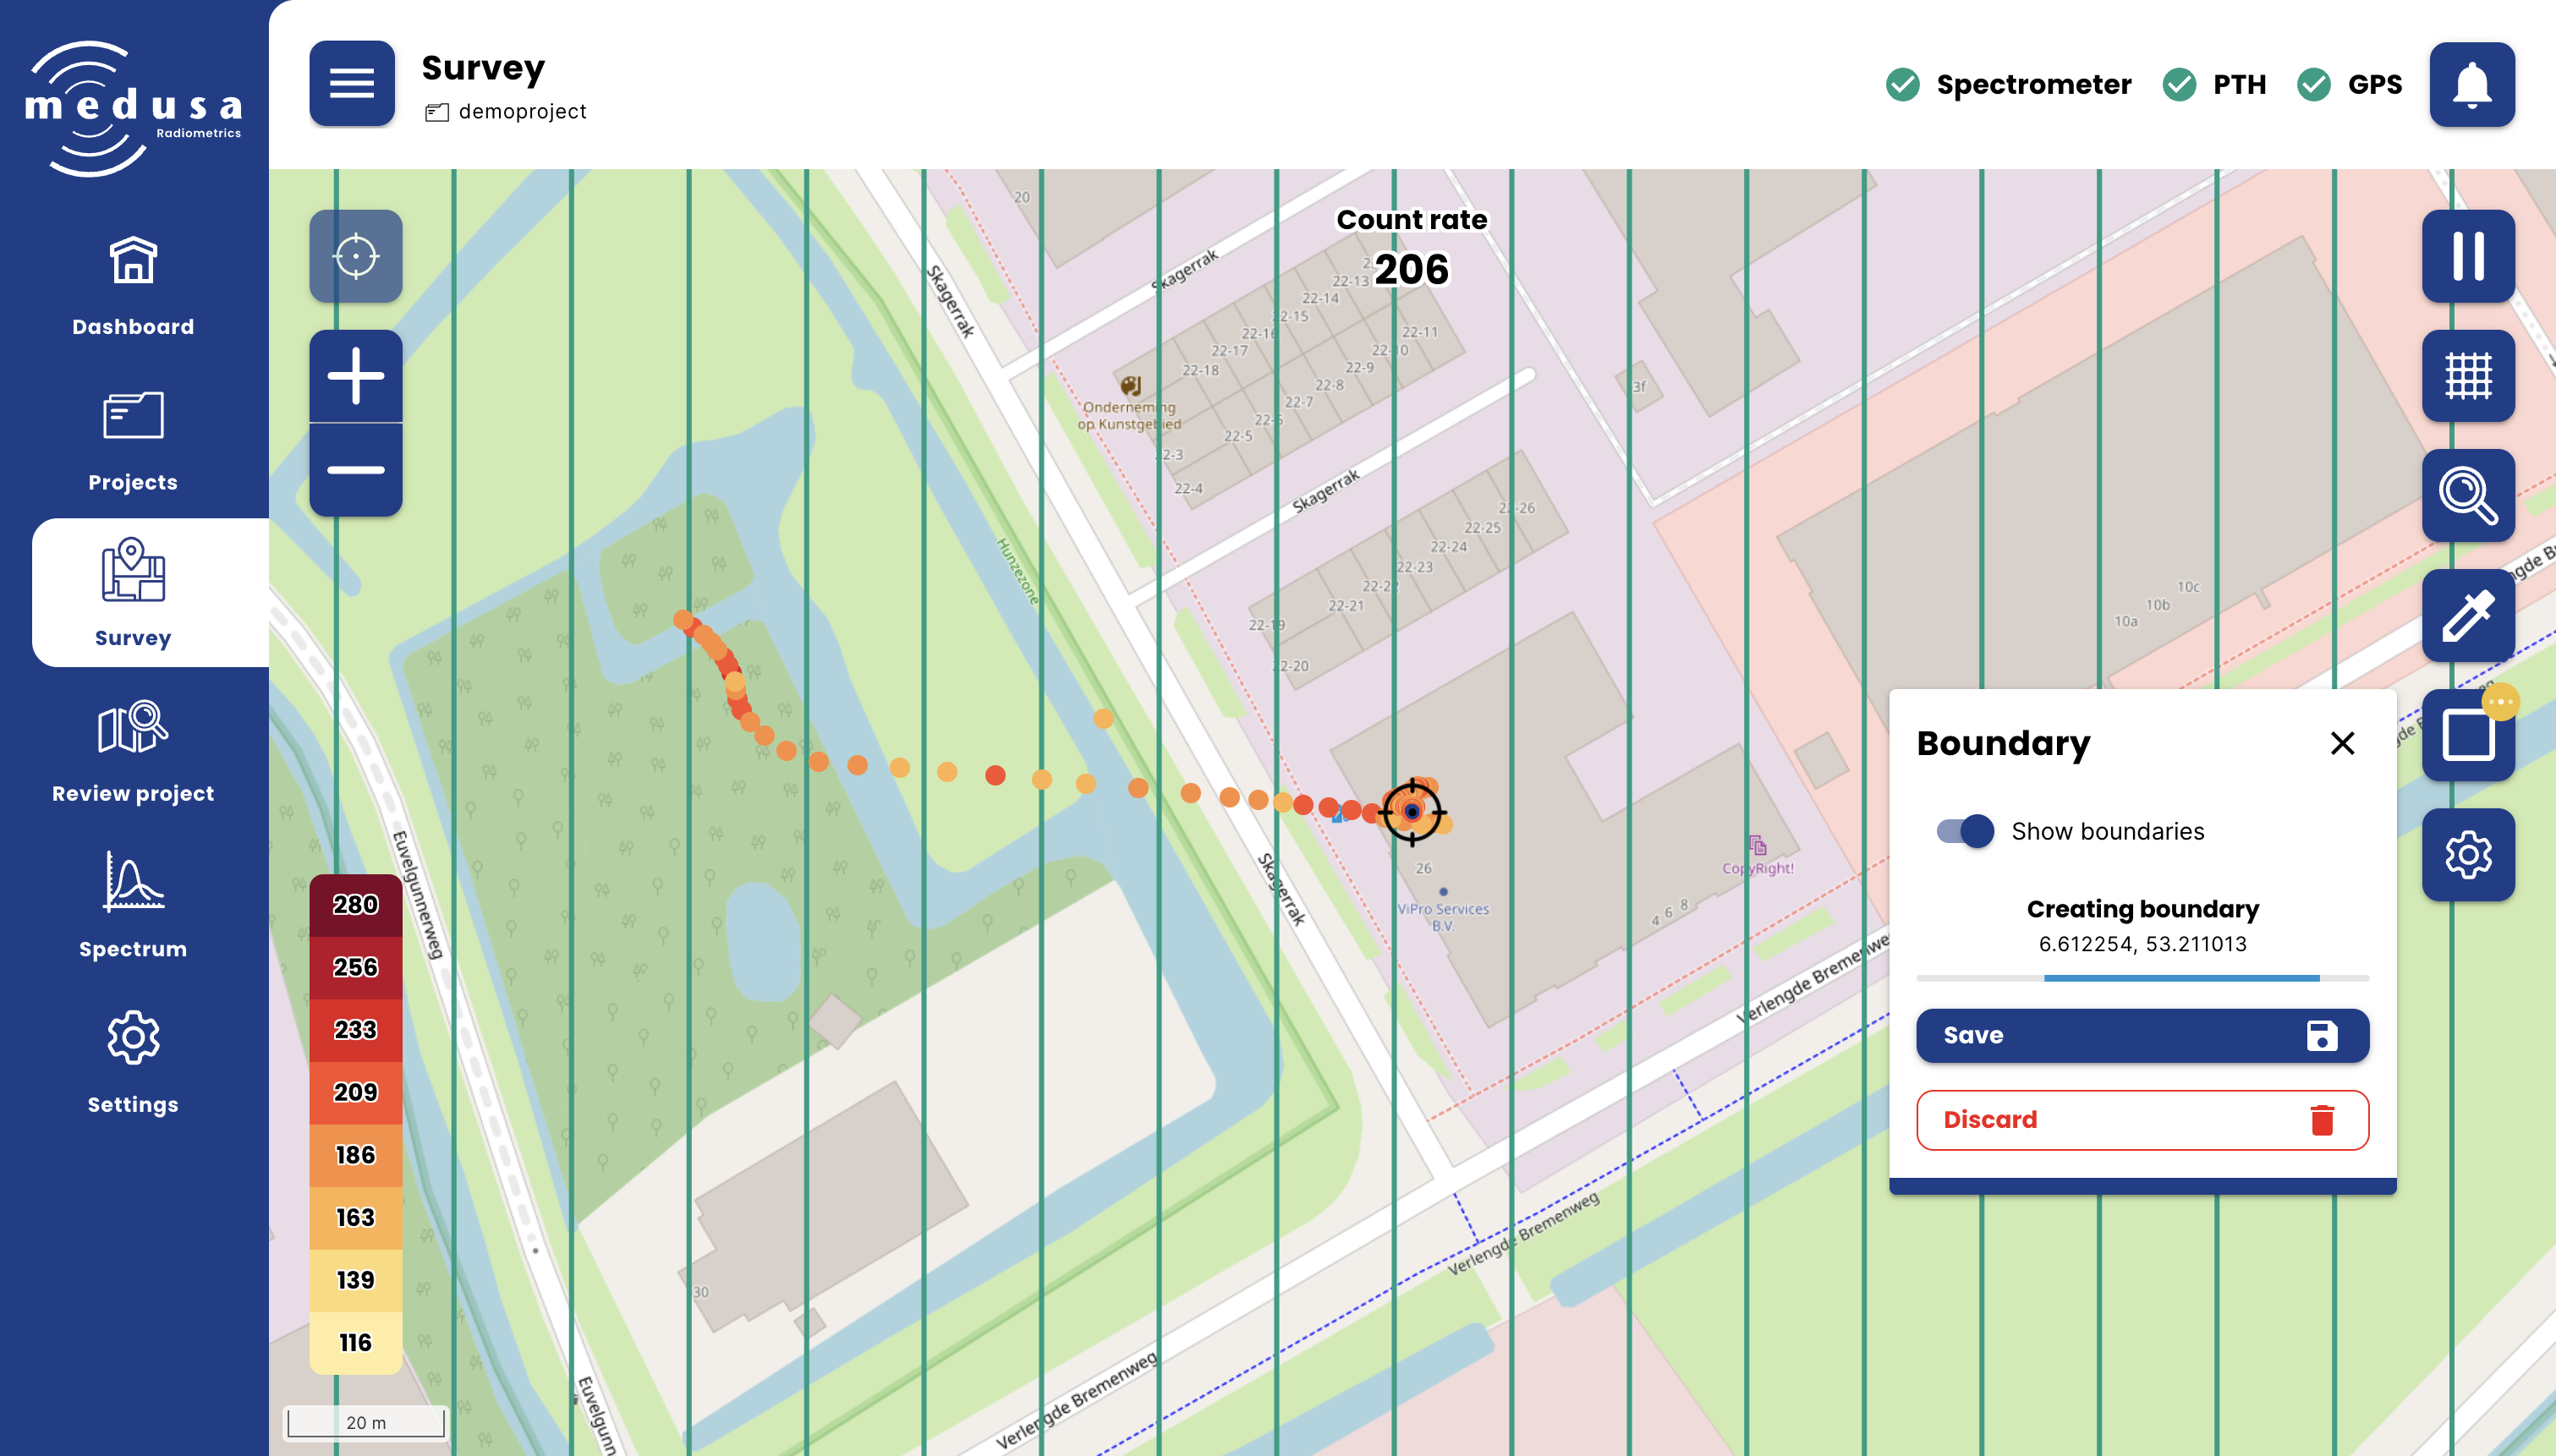
Click Save to store the boundary, or Discard to cancel.
| Action | Description |
|---|---|
| Show boundaries | Toggle to show or hide boundaries on the map |
| Delete boundaries | Remove a single boundary or delete all boundaries |
Map Settings
The Map settings panel controls the appearance of the map. These settings are stored per device in the browser and only used for displaying data.
| Setting | Description |
|---|---|
| Show online map | Toggle the online background map on or off. Disable this when using a downloaded offline map or when no internet connection is available. |
| Unit system | Metric (m) or imperial |
| Marker size | The size of the data points plotted on the map |
Downloading an Offline Map
If you will be working in an area without internet access, download the map tiles before leaving.
Zoom the map to the area you want to cover, then open Map settings and click Download map. A notification appears when the download is complete. Once downloaded, disable Show online map to use the offline tiles.
Downloaded map tiles are stored on the detector and can be managed under Settings → Map.