

Appearance
Viewing the Spectrum
The Spectrum page shows the live gamma-ray spectrum measured by the detector, along with the radionuclide concentrations derived from it. It is useful for monitoring measurement quality in real time and for inspecting the calibration file loaded on the detector.
Navigate to Spectrum in the sidebar to open it.
Energy Stabilization
When the detector starts up, the spectrometer goes through an energy stabilization process before radionuclide concentrations can be calculated. Stabilization works by aligning the measured spectrum to a known energy scale — this is necessary because the response of the scintillation crystal shifts slightly with temperature.
To calculate a valid stabilization, the spectrometer needs to collect at least 10,000 counts in the 400–3,000 keV energy range. Depending on the size of the crystal and the ambient radiation level, this typically takes a few minutes. Progress is shown in the header as "The spectrometer is stabilizing (x%)". After the initial stabilization is completed, the detector continuously updates the stabilization during operation to compensate for temperature variations throughout the measurement.
Until stabilization is complete, the spectrum is visible but radionuclide concentrations are not shown.
The Spectrum Plot
The spectrum is plotted on a logarithmic scale with energy (×10 keV) on the x-axis and counts on the y-axis. When a stabilized spectrum is plotted, the plot shows the fitted radionuclide concentrations. These are the standard spectra multiplied by the found concentration. The sum of these radionuclide spectra is shown in a light blue color and should line up with the summed measured data points ( blue points). The radionuclides included in the analysis and shown on this plot are selected on the spectral analysis settings.
The analysis settings can be found Settings → Sensors → Spectral → Active Nuclides
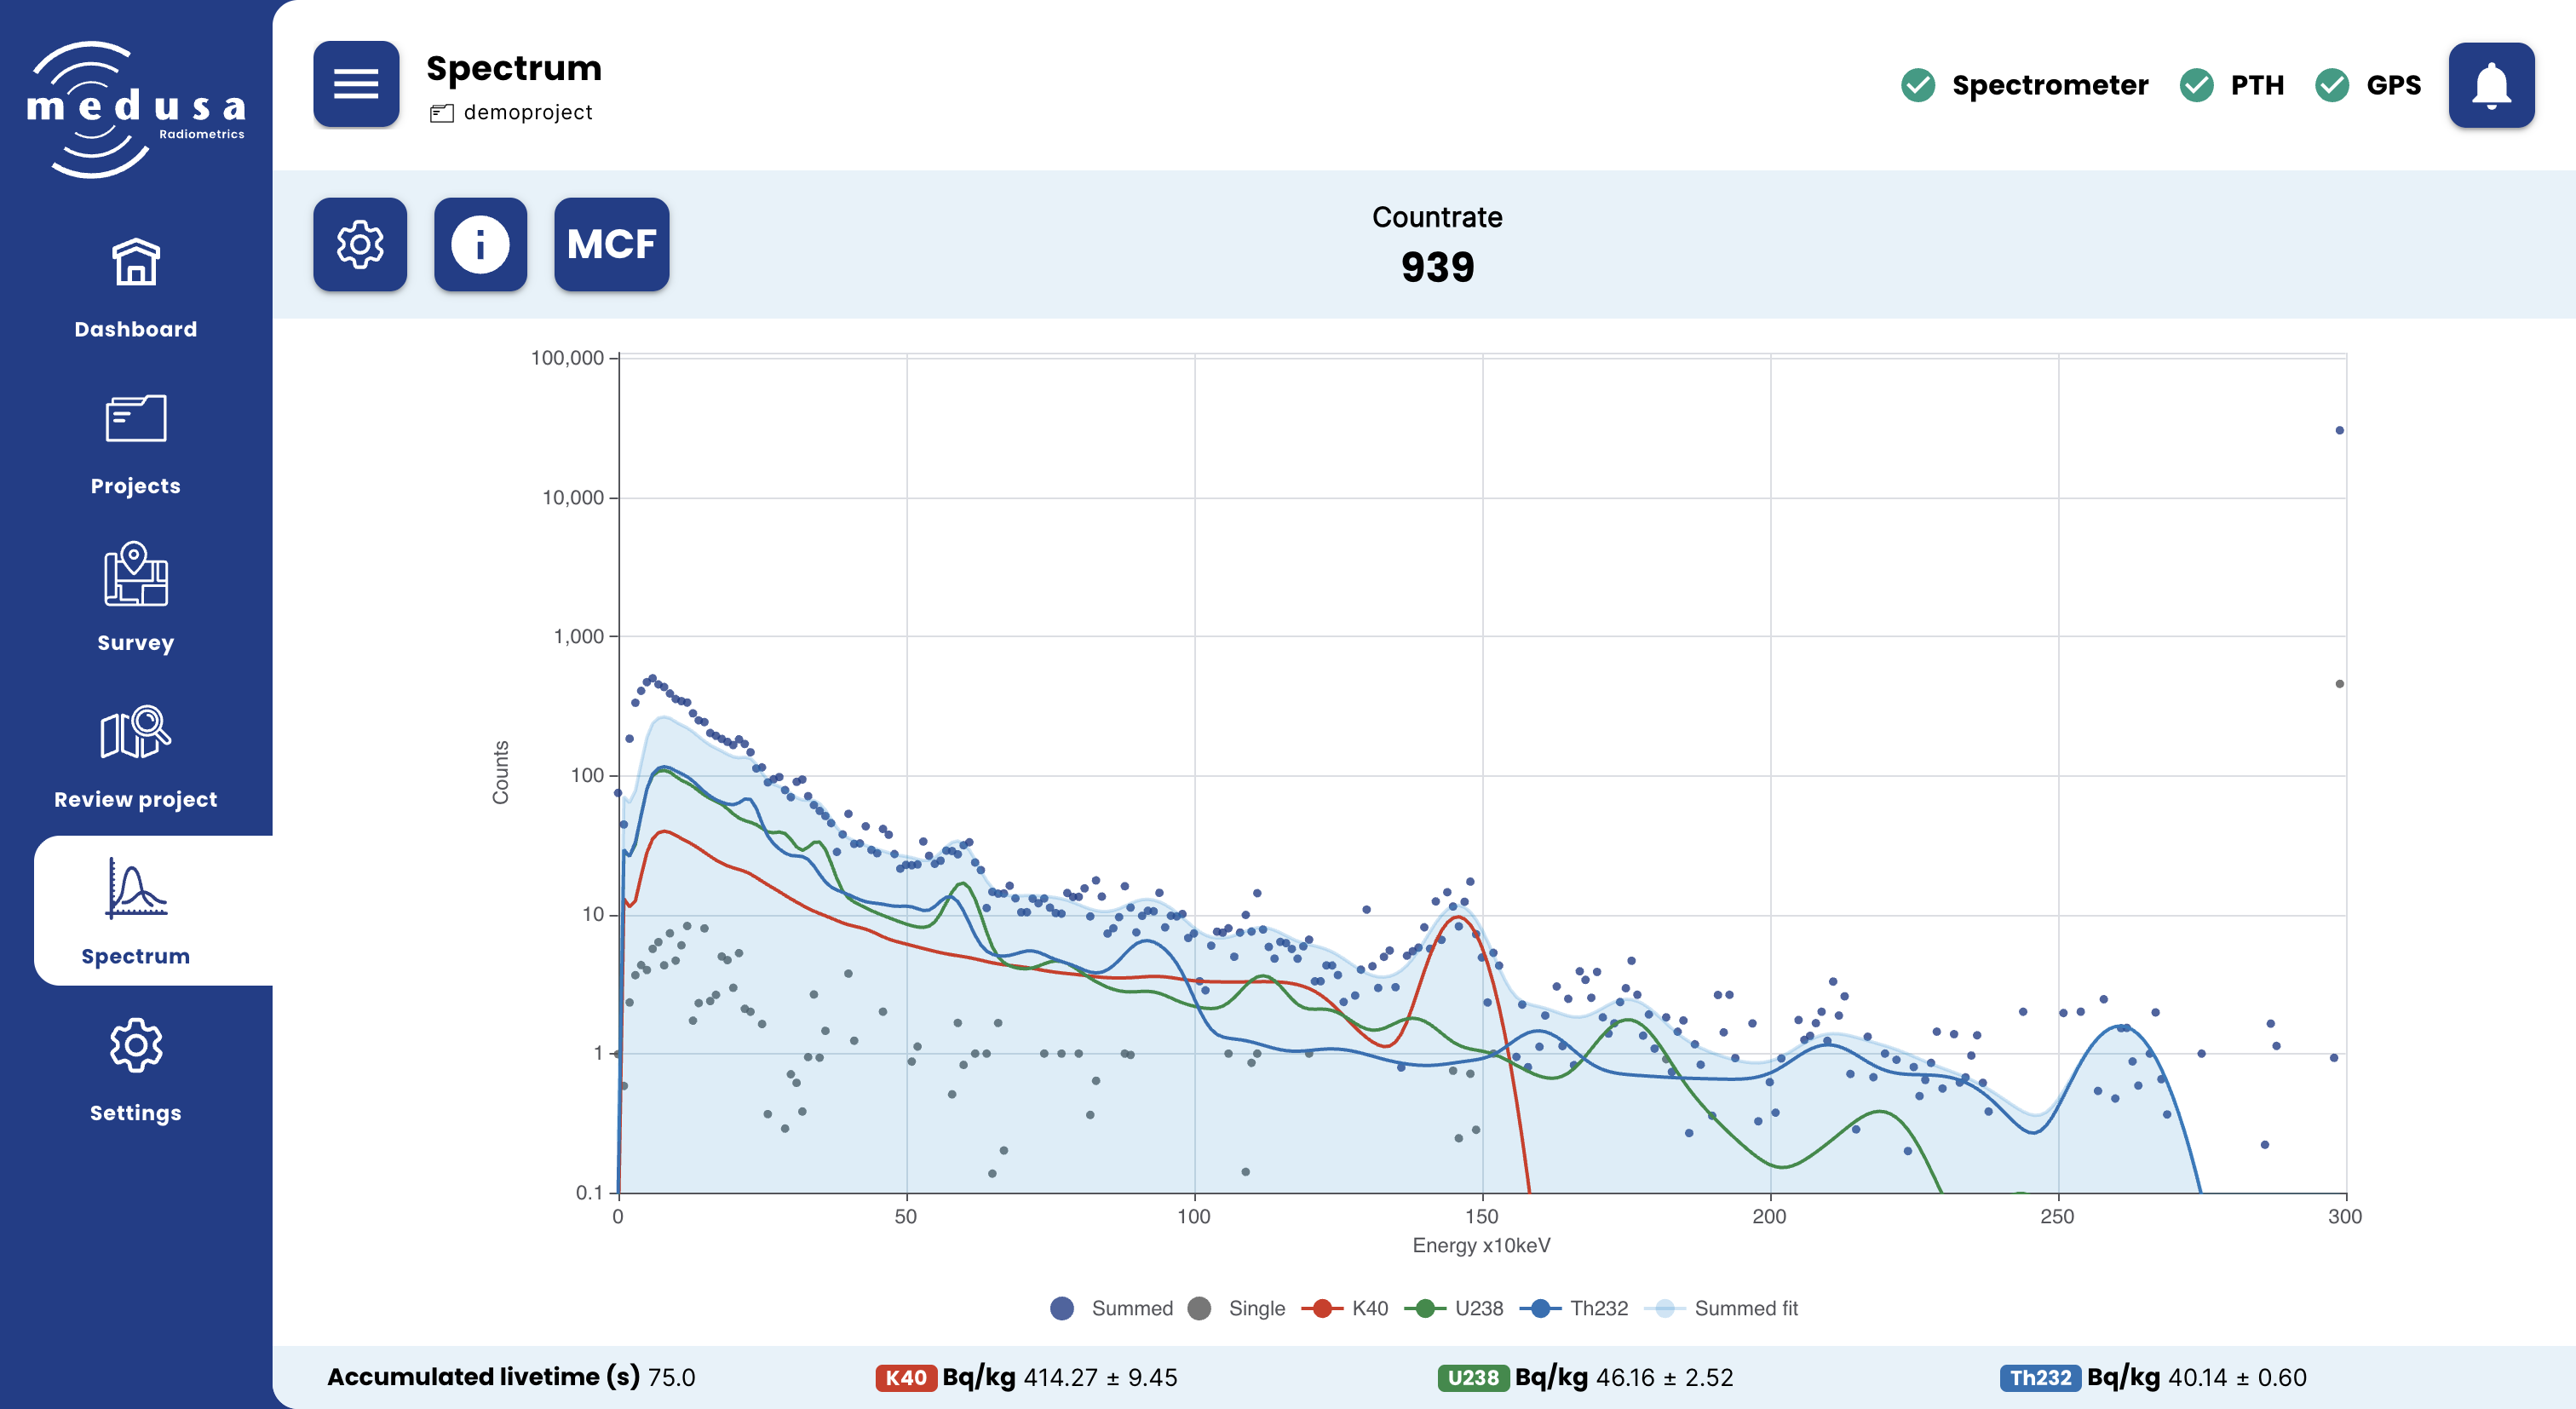
The table below explains the legend when K40, U238 and Th232 are the selected nuclides in Settings → Sensors → Spectral → Active Nuclides.
| Legend item | Description |
|---|---|
| Summed | The accumulated spectrum, built up by summing incoming spectra (blue points) |
| Single | The most recent single measured spectrum (gray points) |
| K40 | The standard spectrum for ⁴⁰K fitted to the data (red line) |
| U238 | The standard spectrum for ²³⁸U fitted to the data (green line) |
| Th232 | The standard spectrum for ²³²Th fitted to the data (blue line) |
| Summed fit | The sum of all fitted nuclide spectra (light blue area) |
Each legend item can be toggled by clicking on it.
Info
Note: The standard spectra for each nuclide are taken from the active Medusa Calibration File (MCF). Calibration spectra are unique to each detector and cannot be used on a different sensor.
Radionuclide Concentrations
The bottom bar shows the accumulated livetime and the activity concentration of each active nuclide in Bq/kg ± uncertainty. Concentrations are only shown once the spectrometer has stabilized.
The active nuclides can be configured under Settings → Sensors → Spectral → Active nuclides.
Spectrum Options
Click the Settings ( ) button in the toolbar to open the spectrum options panel.
| Setting | Description |
|---|---|
| Plot raw spectrum | When enabled, the raw (unstabilized) spectrum is shown instead of the energy-stabilized spectrum |
| Plot every X seconds | The number of seconds of spectra to accumulate before updating the plot |
| Clear spectrum | Clears the accumulated spectrum and starts fresh |
| Reset stabilization | Resets the energy stabilization — the spectrometer will need to restabilize before concentrations are shown again |
Spectrum Info
Click the Info ( ) button in the toolbar to open the spectrum info panel.
| Field | Description |
|---|---|
| Stabilization | The current stabilization parameter, indicating the energy shift applied to align the spectrum to the energy scale |
| Measurement (s) | The live time of the last measured spectrum in seconds |
| Deadtime | The dead time of the last measurement as a percentage |
| Dose rate | The dose rate derived from the spectrum in µGy/h |
Note: The dose rate shown here is a rudimentary estimate based on energy deposited in the crystal. For a biologically weighted H*(10) dose rate, use GammAn.
The Medusa Calibration File (MCF)
Click the MCF button in the toolbar to view information about the calibration file currently loaded on the detector.
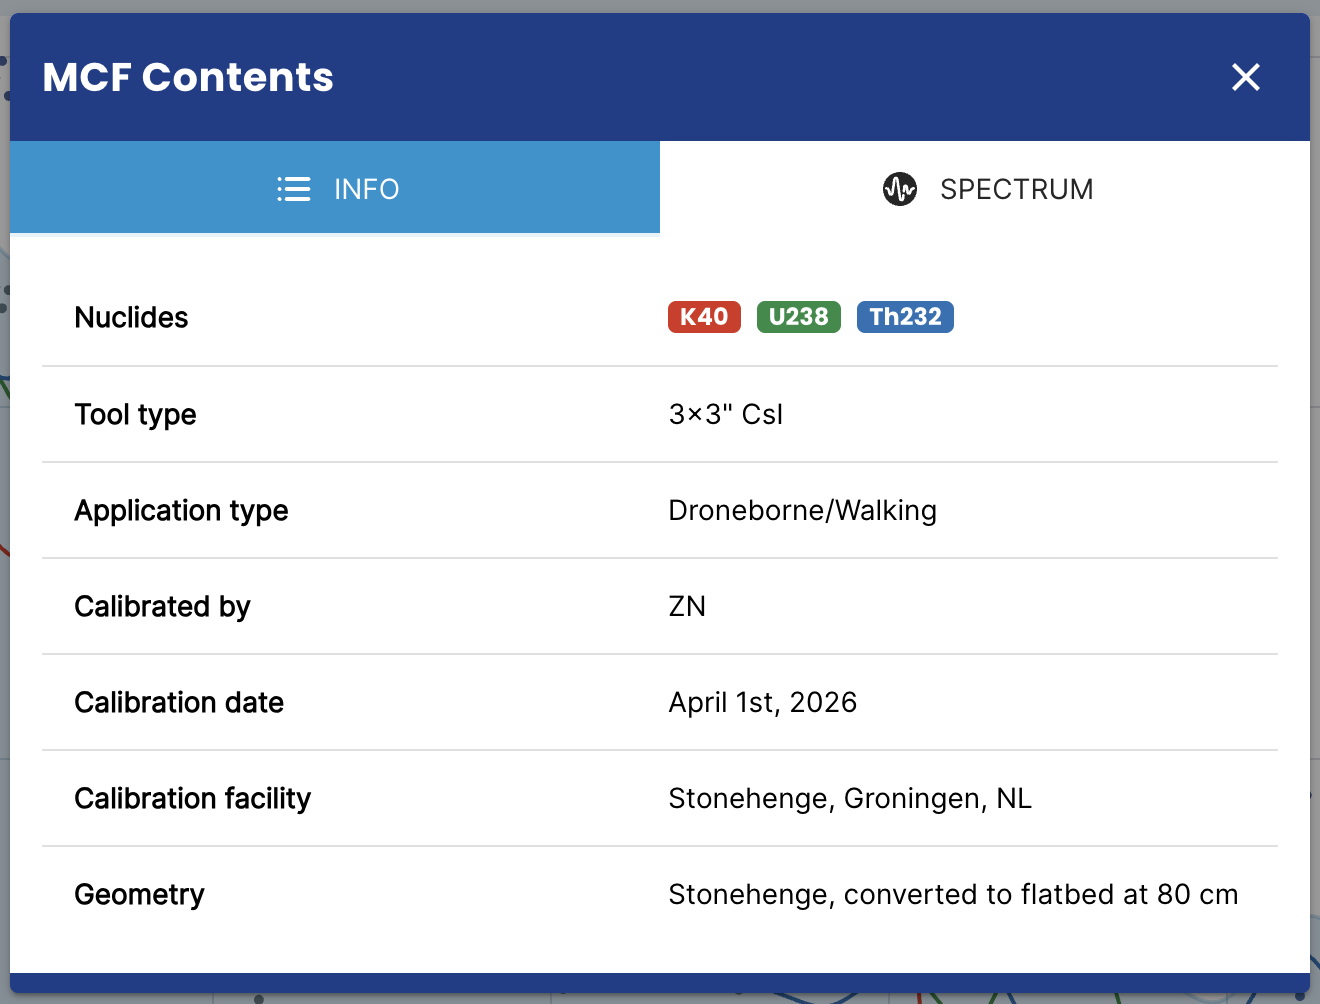
Info
| Field | Description |
|---|---|
| Nuclides | The nuclides included in the calibration file |
| Tool type | The detector type this calibration was made for |
| Application type | The intended application of this calibration |
| Calibrated for | The organisation the calibration was performed for |
| Calibrated by | The person who performed the calibration |
| Calibration date | The date of the calibration |
| Calibration facility | The facility where the calibration was performed |
| Geometry | The measurement geometry used during calibration |
| Notes | Additional notes about the calibration |
Spectrum
The Spectrum tab shows the standard spectra for each nuclide in the calibration file. These can be downloaded as a CSV file using the Download spectrum as CSV button.
MCF files are managed under Settings → Sensors → Spectral.