

Appearance
Reviewing and Downloading Data
The Review project page lets you inspect recorded survey data after a measurement. Unlike the Survey page, it has no live GPS updates and does not support taking new samples or drawing boundaries.
Opening a Project for Review
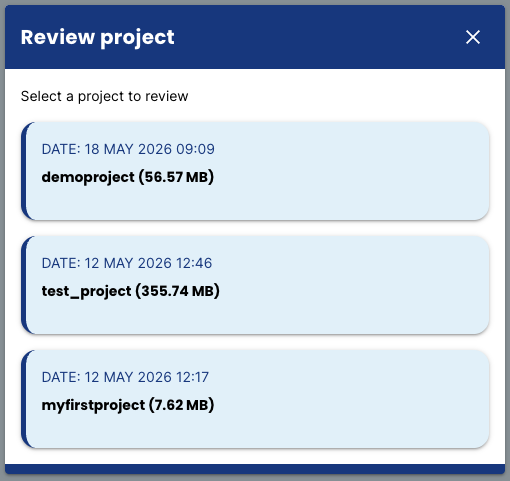
Click Review project in the sidebar or on the Dashboard. A dialog opens where you select which project to review. The name of the reviewed project is shown in the header below the page title.
Info
Note: Reviewing a project does not change the active project. Data continues to be logged to the active project while you review.
Exploring the Map
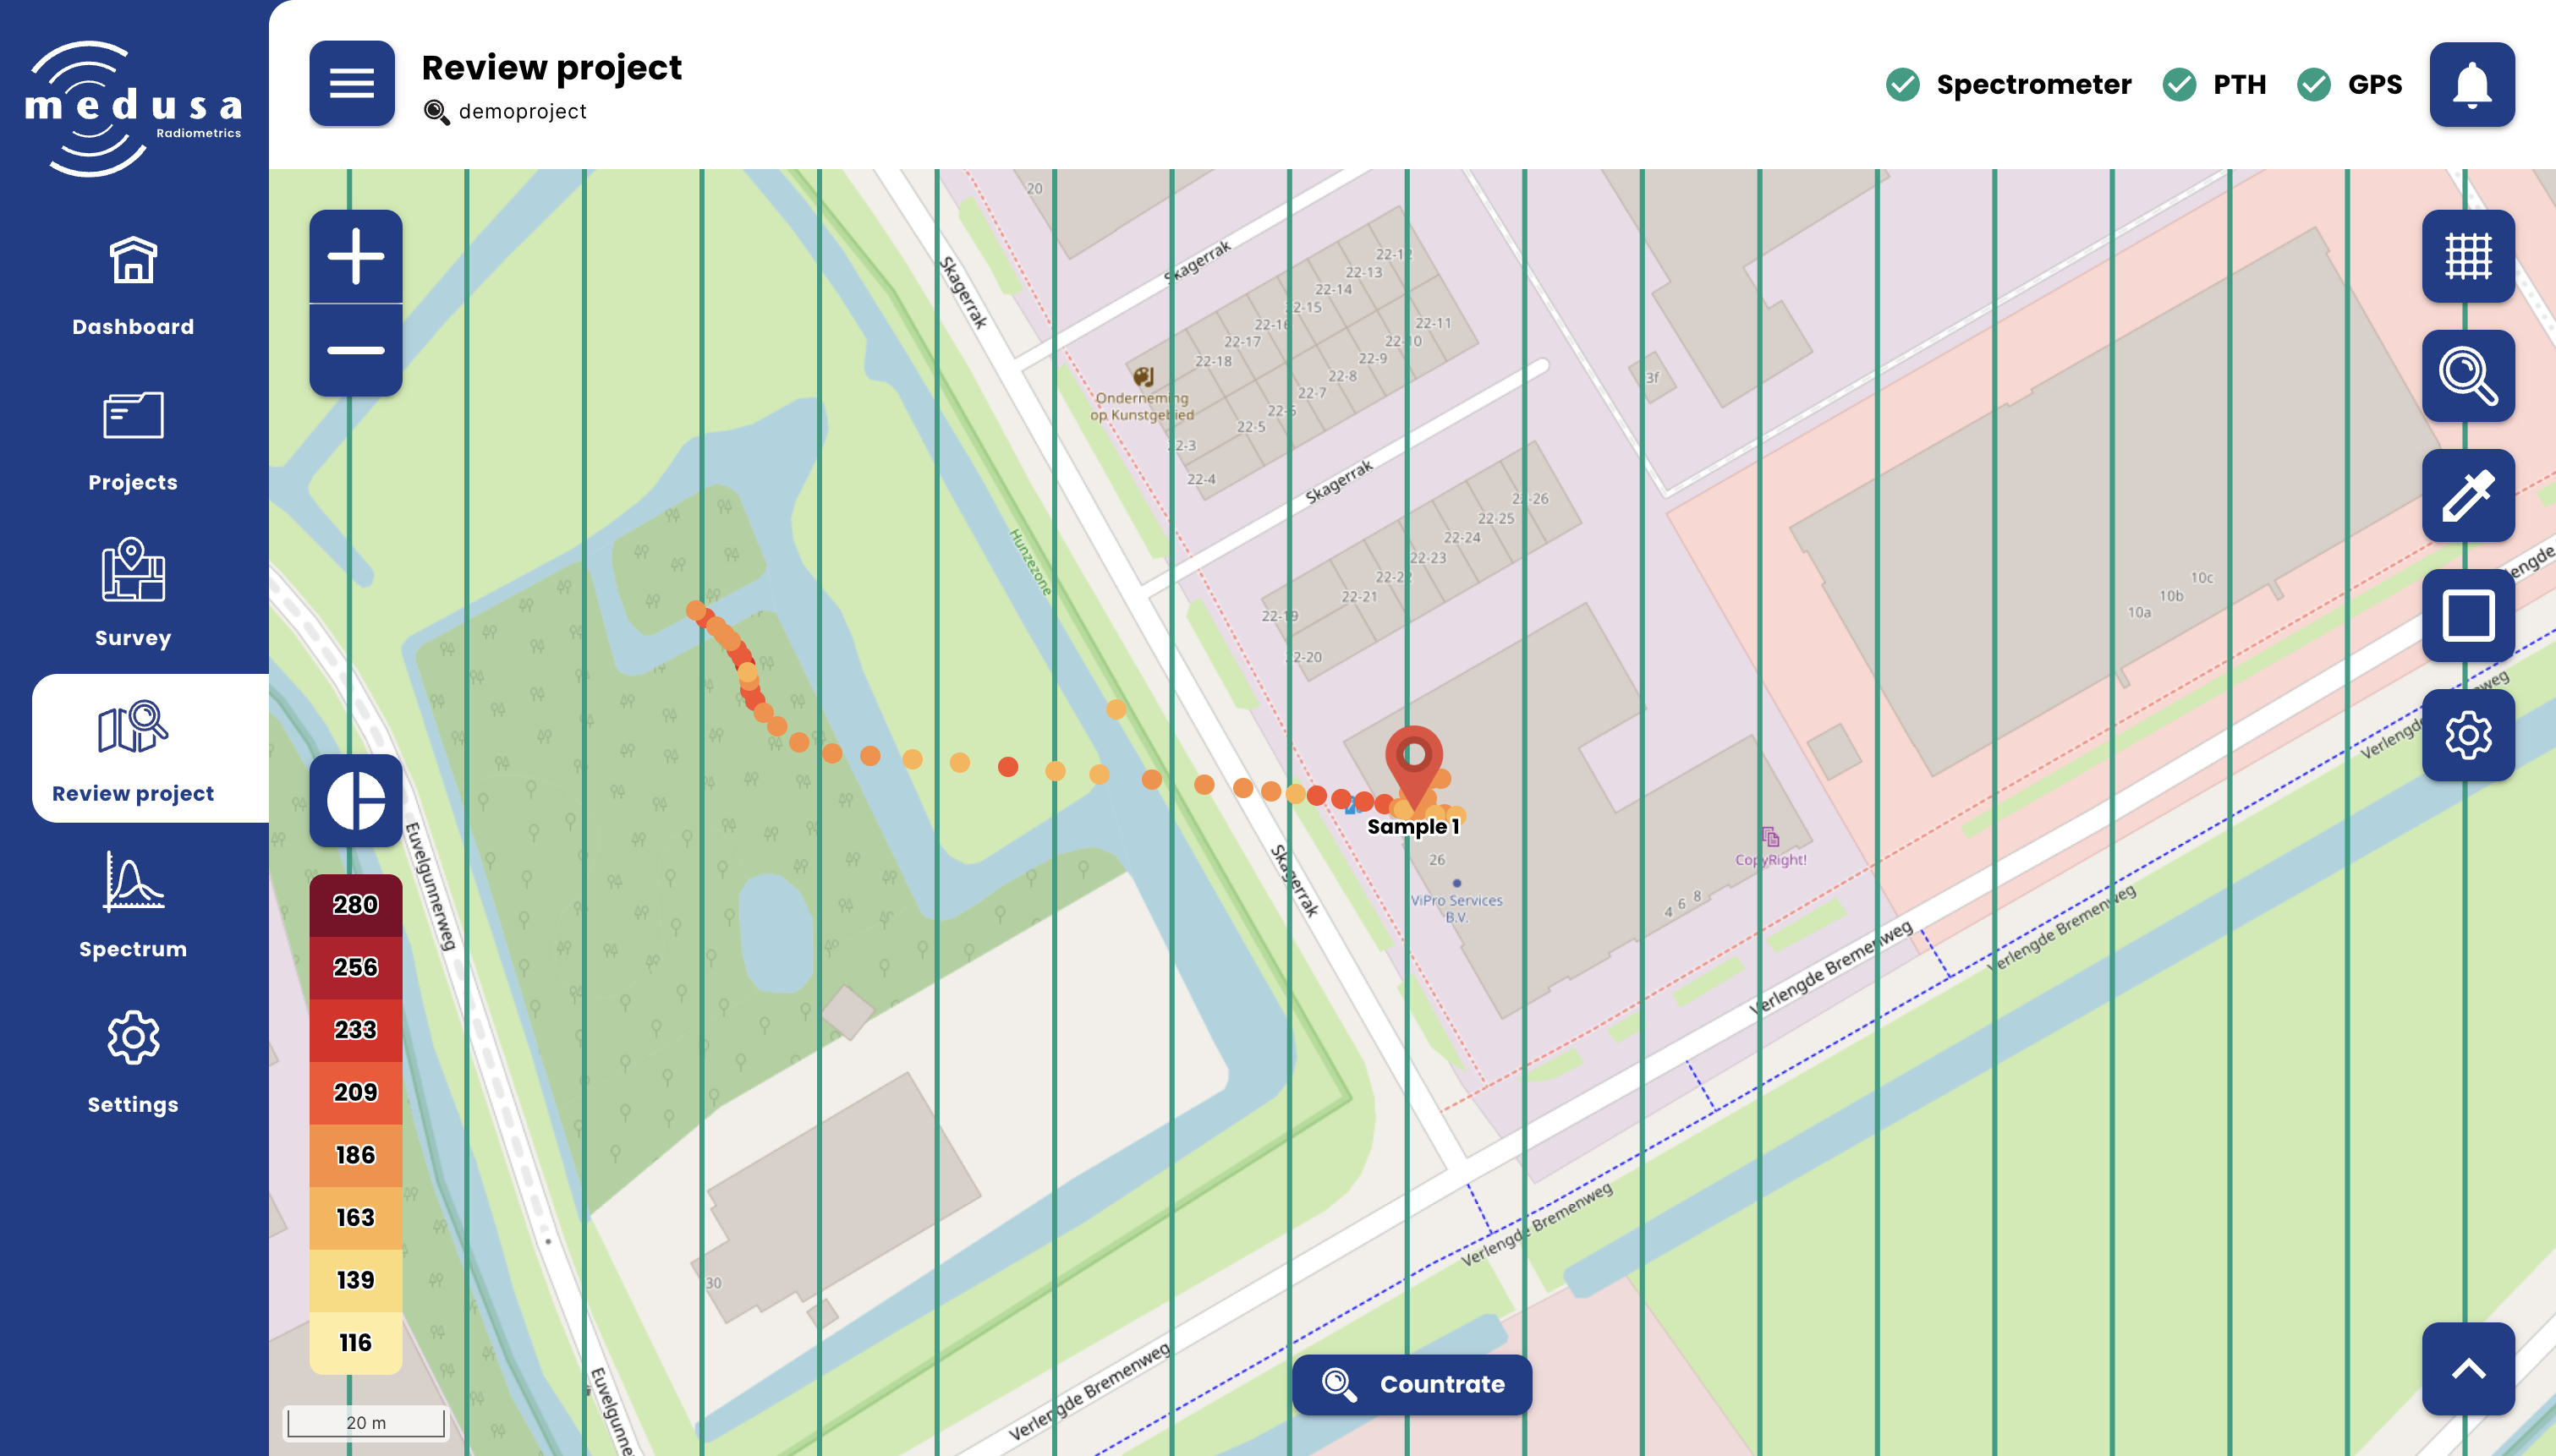
The map works the same way as on the Survey page, with two additions in the left toolbar.
Left Toolbar
| Icon | Button | Description |
|---|---|---|
 | Colour scale range | Cycles through colour scale modes: Min-max → Standard deviation × 1 → Standard deviation × 2 |
The colour scale range modes reduce the influence of outliers on the colour scale. Use standard deviation mode when a small number of high or low values are compressing the rest of the data into a narrow colour range.
Choosing What to Display
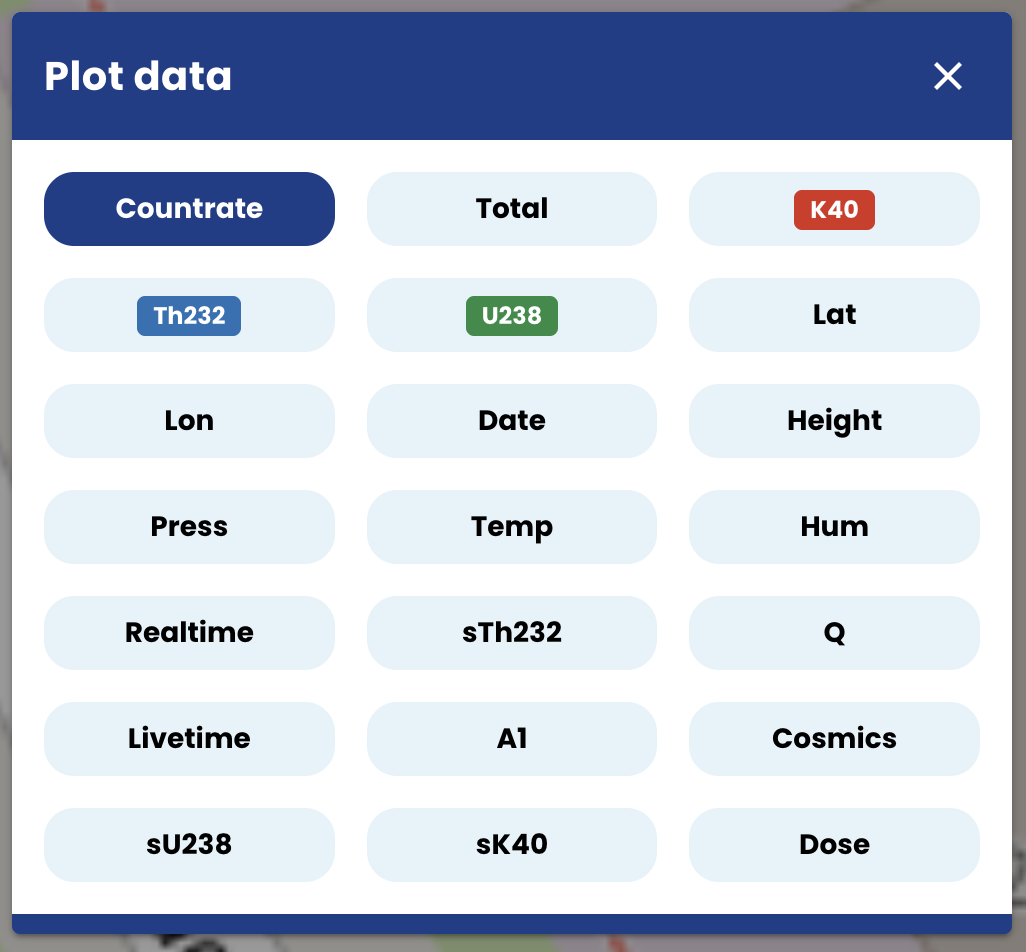
The parameter selector at the bottom of the map determines which data is displayed. Click it to open the list of available parameters. The table below shows a number of typical parameters that may be present in the dataset. The exact set of available parameters depends on the configured radionuclides and the enabled or connected auxiliary sensors.
| Parameter | Description |
|---|---|
| Countrate | Total gamma count rate in cps |
| K40 | Activity concentration of ⁴⁰K in Bq/kg |
| U238 | Activity concentration of ²³⁸U in Bq/kg |
| Th232 | Activity concentration of ²³²Th in Bq/kg |
| Cs137 | Activity concentration of ¹³⁷Cs in Bq/kg |
| Dose rate | Dose rate in µGy/h |
Sample Locations, Samples, and Boundaries
The Sample locations, Samples, and Boundary panels work the same as on the Survey page. The only difference is that taking new samples and drawing new boundaries is not available — both require a live GPS position.
Sample locations can still be calculated, uploaded, and deleted.
The Samples Table
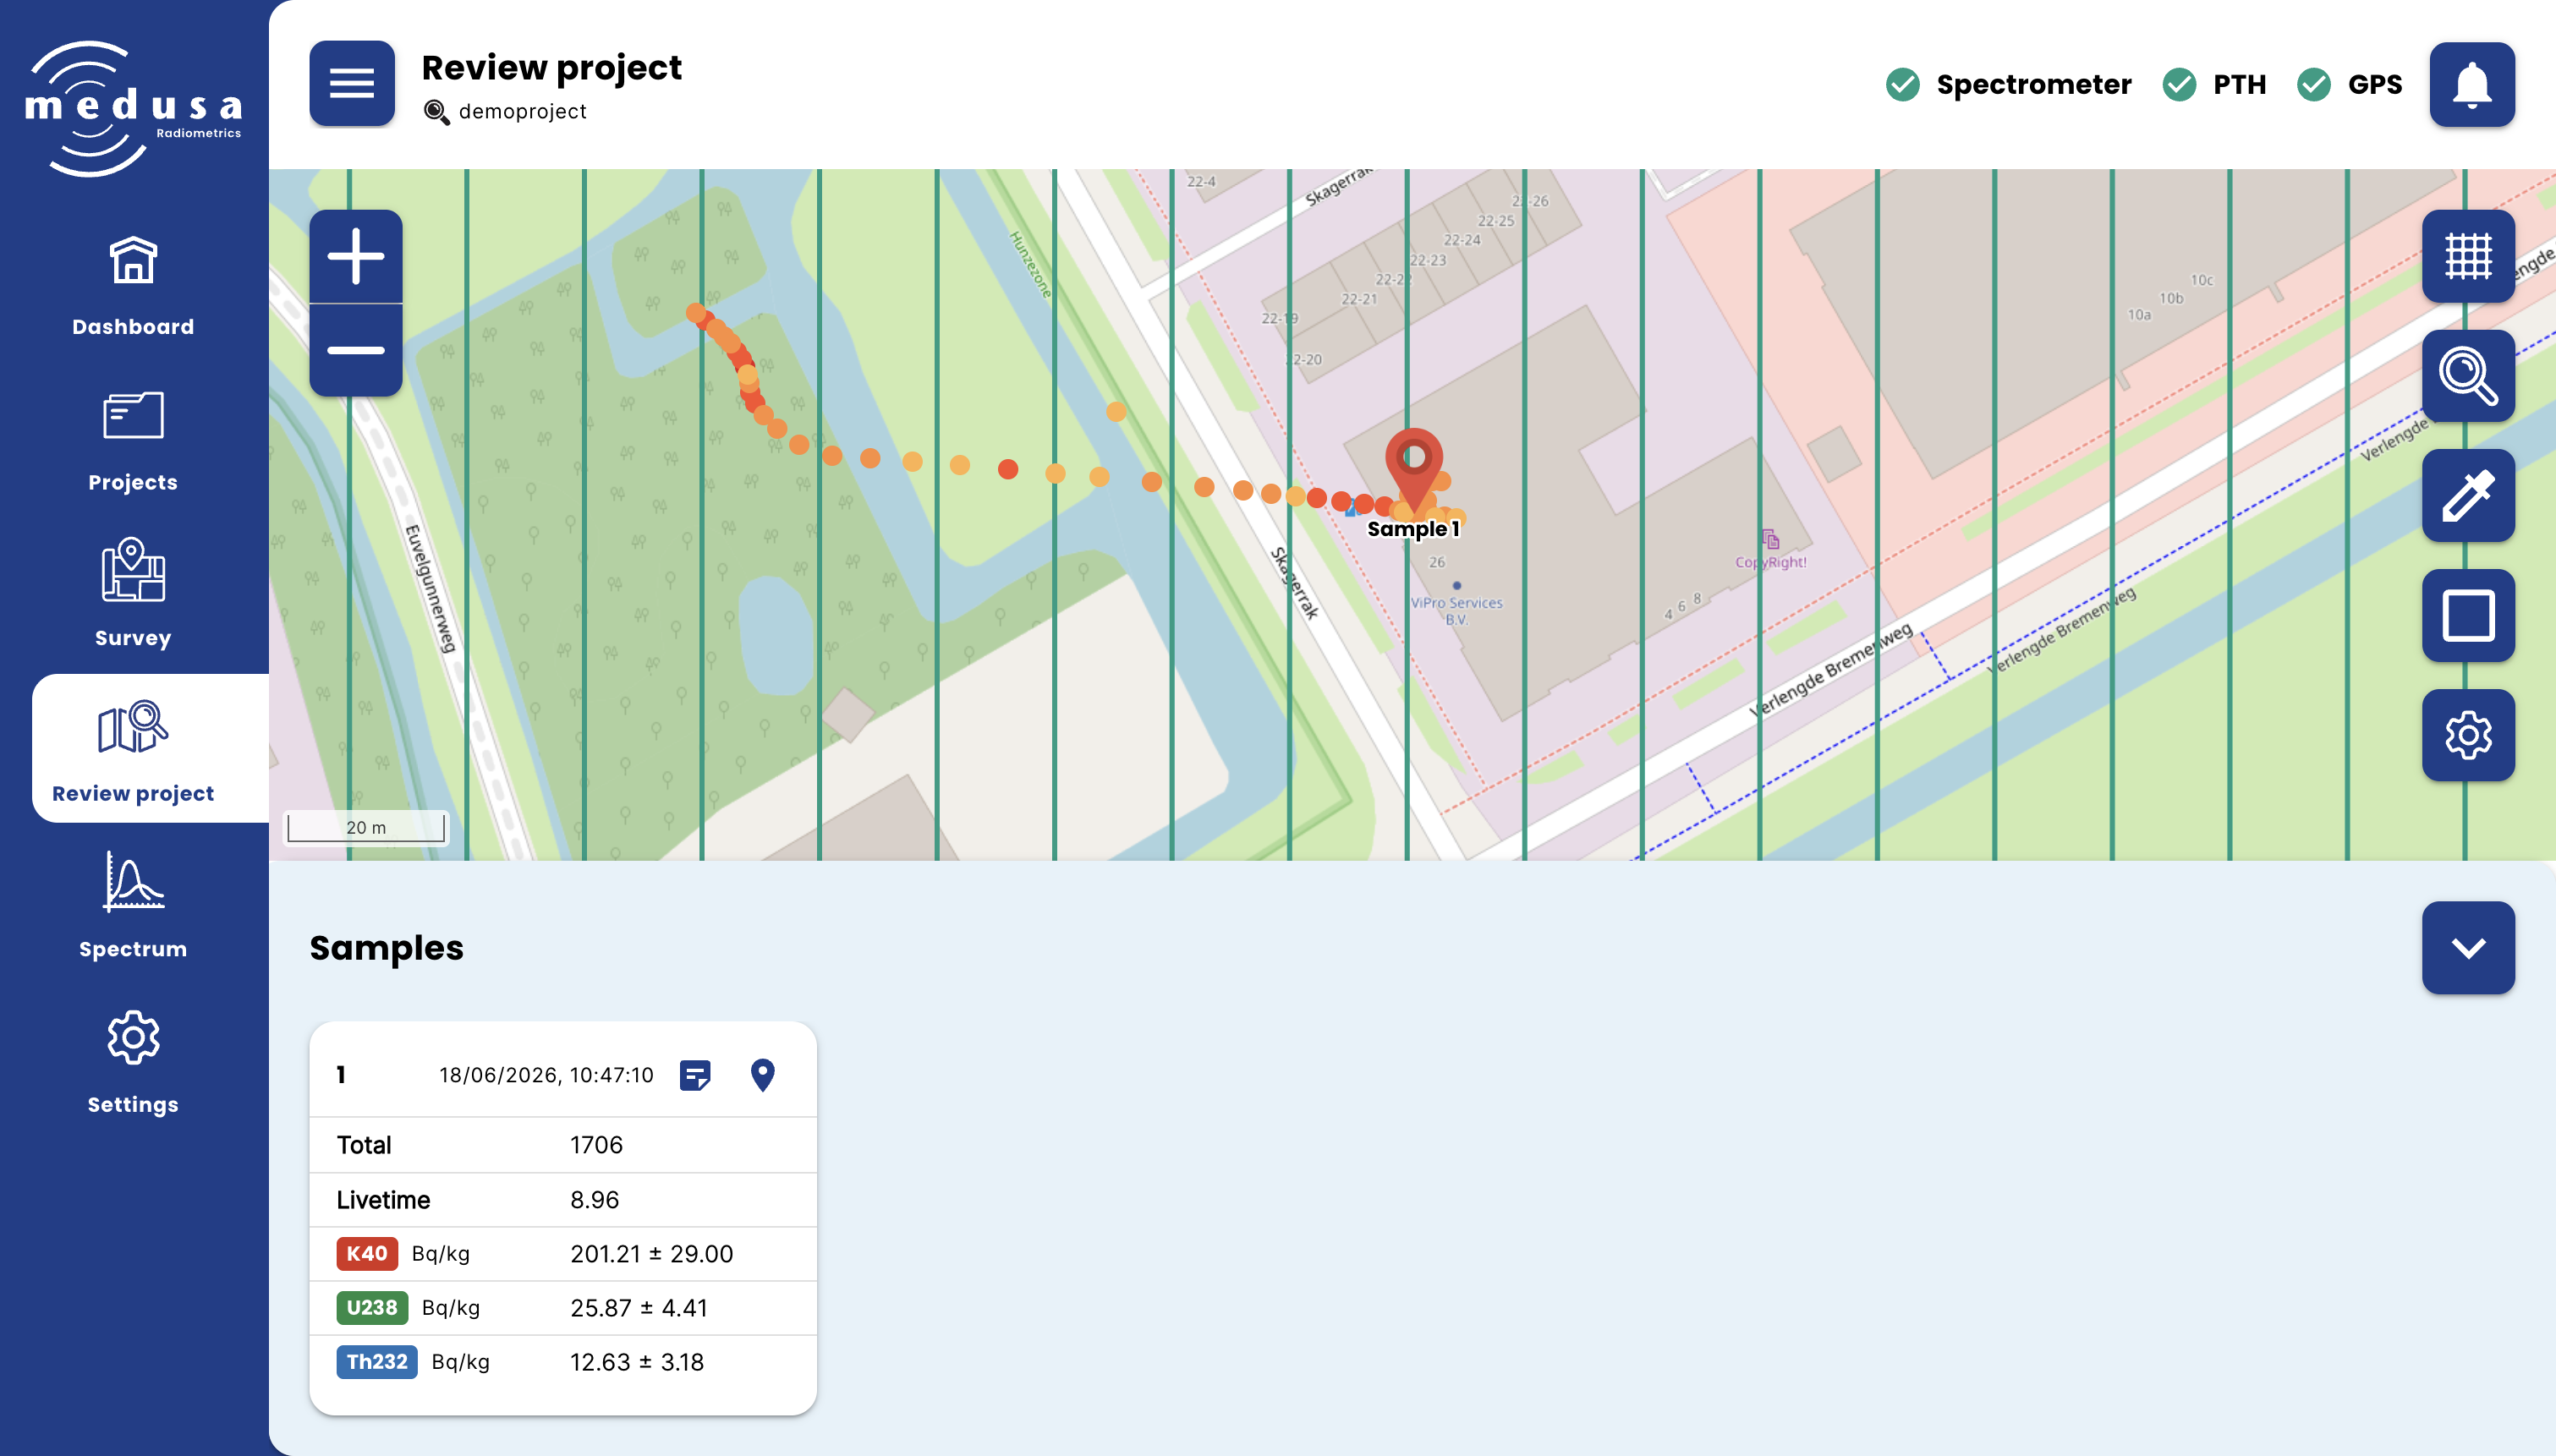
If the project contains samples, a button in the bottom right of the map expands a table below the map listing all samples in the project.
| Field | Description |
|---|---|
| Number | The sample index |
| Date / time | The date and time the sample was recorded |
| Note | If you enter a note when saving the sample you can view this note by clicking on the note icon. |
| Location pin | Click to centre the map on this sample |
| Total | Total counts in the sample spectrum |
| Livetime | The live measurement time in seconds |
| Nuclides | Activity concentration of each nuclide that was active at the time of sampling (Bq/kg ± uncertainty). Which nuclides appear depends on the active nuclides configured under Settings → Sensors → Spectral at the moment the sample was taken. |
Downloading a Project
Downloading is done from the Projects page. See Project Management — Downloading a Project for a full description of the available file types and the download process.